
Last major update issued on February 18, 2011 at 05:30 UTC. Minor update posted at 15:05 UTC
[Solar and geomagnetic data - last month (updated daily)]
[Solar wind and electron fluence charts (updated daily)
[Solar cycles 21-24 (last update February 1, 2011)]
[Solar cycles 1-20]
[Graphical comparison of cycles 21, 22, 23 and 24 (last update
February 1, 2011)]
[Graphical comparison of cycles 10, 12, 13, 14, 16 and 24 (last update
February 1, 2011)]
[Historical solar and geomagnetic data charts 1954-2006 (last update April 5, 2007)]
[Archived reports since January 2003 (last update February
1, 2011)]
[POES auroral activity level
charts since October 2009]
Annotated geomagnetic activity charts - Carrington rotation 2104
[Nov-Dec.2010]- 2105
[Dec-Jan.2011] NEW
The geomagnetic field was quiet on February 17. Solar wind speed ranged between 300 and 348 km/s. A solar wind shock was observed at ACE at about 00:40 UTC on February 18. This was the arrival of the CME observed on February 15. Although the arrival time was later than expected the total field of the interplanetary magnetic field is strong. If the field swings fully southwards severe geomagnetic storming will be possible. The IMF has been predominantly northwards so far resulting in only a small disturbance as this is written.
Solar flux measured at 20h UTC on 2.8 GHz was 110.9 (increasing 23.4 over the last solar rotation). The planetary A index was 2 (STAR Ap - based on the mean of three hour interval ap indices: 2.0). Three hour interval K indices: 00000111 (planetary), 00000122 (Boulder).
The background x-ray flux is at the class B5 level.
At midnight UTC the visible solar disk had 5 spotted regions.
Region 11158 decayed slowly. There is still a magnetic delta structure
in a central penumbra, however, the delta is much smaller than it was a few days
ago. There is still a chance of major flares.
Flares: C6.1 at 01:46, C2.3 at 03:08, C1.5 at 04:15, C1.0 at
05:36, C1.2 at 06:47, C1.2 at 08:13, C1.9 at 09:30, C2.6 at 10:28, C2.2 at
10:44, C2.4 at 12:36, C1.3 at 15:54 and C1.1 at 21:35 UTC.
Region 11160 (SWPC duplicate number is 11161) was quiet and didn't change
significantly.
Spotted regions not numbered by NOAA/SWPC:
[S878] This region emerged in the northeast quadrant on February 13. Location at midnight:
N21W06
[S880] This region reemerged with tiny spots on February 16 and still had
visible spots on February 17. Location at midnight: N07W41
[S882] This region is quickly emerging close to region 11160. If this
development continues the two regions could start interacting. Location at
midnight: N18E07
Minor updated added at 15:05 UTC: Region S882 has been very unstable and is still developing (see EVE movie). There's a magnetic delta structure in the center of the region and M class flares are possible. Either region 11158 or S882 was the source of an M6.6 flare at 10:11 UTC.

February 15: The X2 event in
region 11158 was associated with a full halo CME.
February 16: No Earth directed CMEs were observed. A filament eruption in
region S878 around 06-07 UTC produced a CME off the northeast limb.
February 17: No obviously Earth directed CME were observed in LASCO and
STEREO imagery.
Coronal hole history (since late October 2002)
Compare today's report to the situation one solar rotation ago:
28 days ago
27 days ago
26 days ago
No significant coronal holes are currently in or near Earth facing positions.

The darkest areas on the solar disk are likely coronal holes.
Long distance low and medium frequency (below 2 MHz) propagation along paths north of due west over high and upper middle latitudes is poor. Propagation on long distance northeast-southwest paths is fair.
The geomagnetic field is expected to be unsettled to major storm on February 18 due to CME effects and quiet to unsettled on February 19-20.
| Coronal holes (1) | Coronal mass ejections (2) | M and X class flares (3) |
1) Effects from a coronal hole could reach Earth
within the next 5 days. When the high speed stream has arrived the
color changes to green.
2) Effects from a CME are likely to be observed at Earth within 96 hours.
3) There is a possibility of either M or X class flares within the next 48 hours.
Green: 0-20% probability, Yellow: 20-60% probability, Red: 60-100% probability.
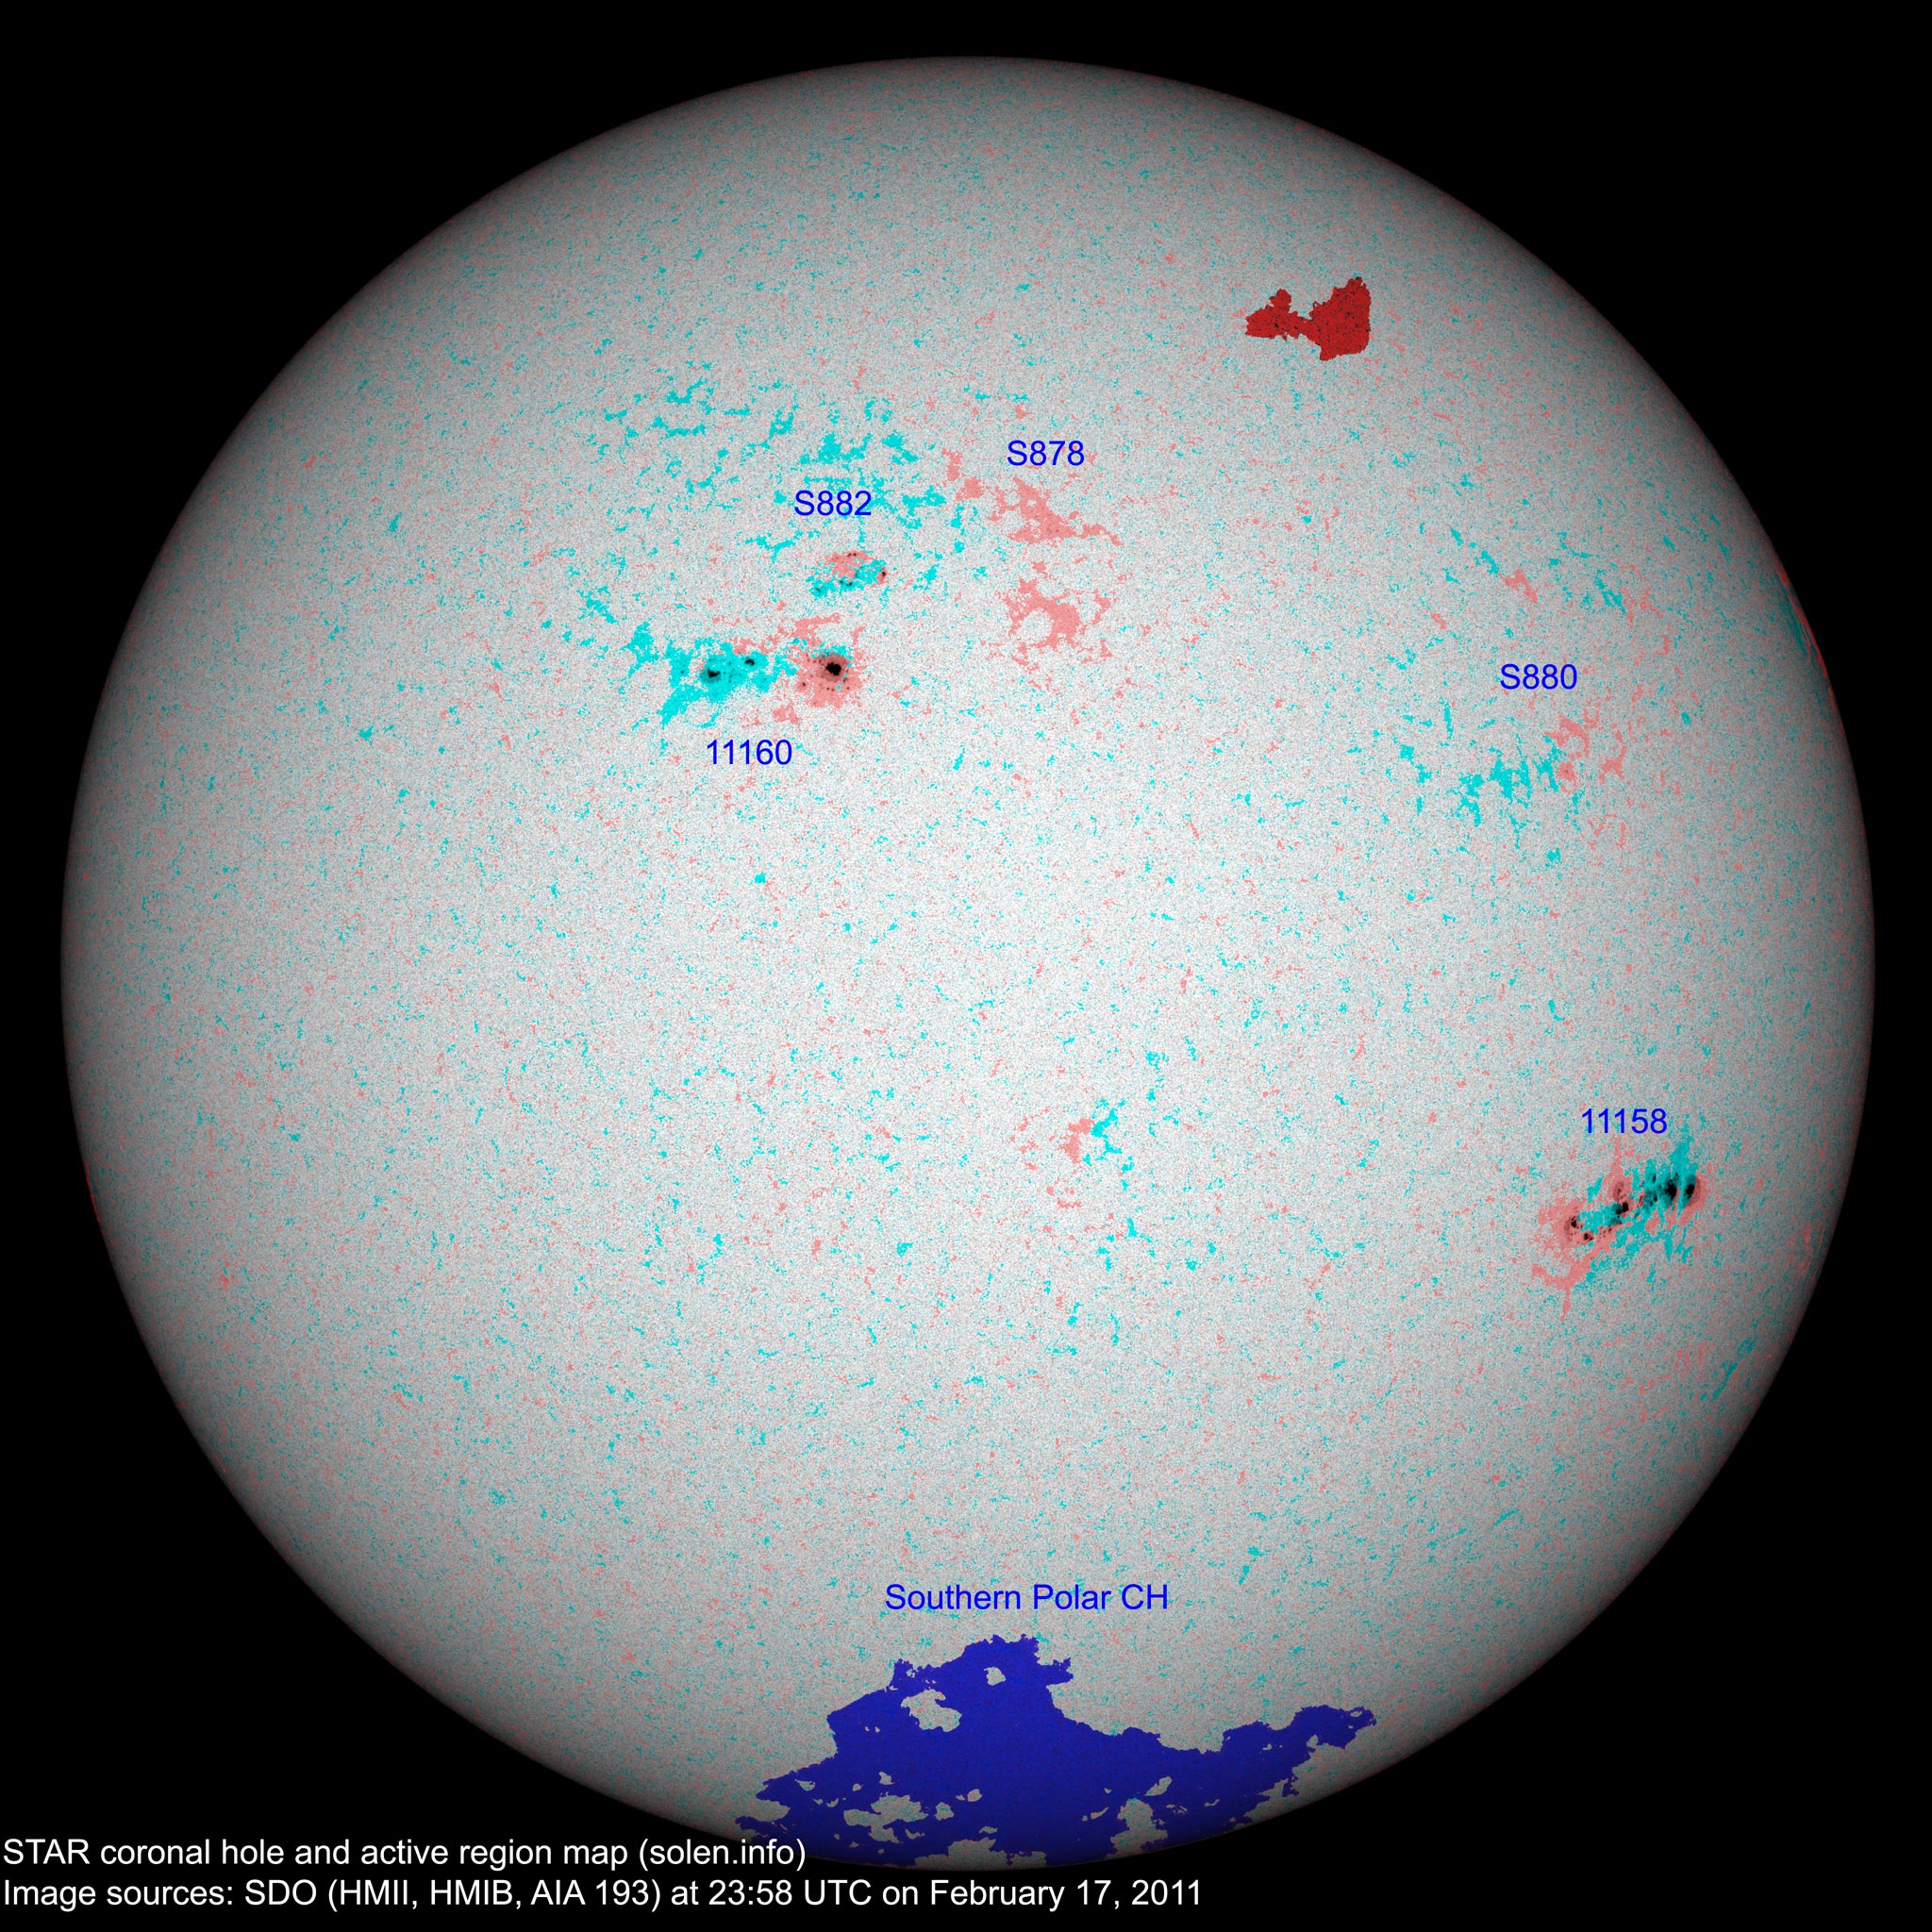
(Click on image for higher resolution image) Compare to the previous day's image
When available the active region map has a coronal hole polarity overlay where red (pink) is negative and blue (blue-green) is positive.
Data for all numbered solar regions according to the Solar Region Summary provided by NOAA/SWPC. Comments are my own, as is the STAR spot count (spots observed at or inside a few hours before midnight) and data for regions not numbered by SWPC or where SWPC has observed no spots. SWPC active region numbers in the table below and in the active region map above are the historic SWPC/USAF numbers.
| Active region | Date numbered detected |
Spot count | Location at midnight | Area | Classification | SDO / HMI 4K continuum image with polarity overlay |
Comment | |||
|---|---|---|---|---|---|---|---|---|---|---|
| SWPC | STAR | SWPC | STAR | Current | Previous | |||||
| 11157 | 2011.02.08 | N19W83 |
 |
plage | ||||||
| 11158 | 2011.02.11 2011.02.10 |
17 | 42 | S19W52 | 0290 | EAC | EAC |
 |
|
beta-gamma-delta |
| 11159 | 2011.02.11 2011.02.10 |
N19W54 | plage | |||||||
| S875 | 2011.02.10 | N20W38 |
 |
plage | ||||||
| S876 | 2011.02.11 | S17W07 | plage | |||||||
| 11160 | 2011.02.12 | 14 | 27 | N12E13 | 0140 | EAC | ESI |
 |
 |
SWPC: 11161 |
| S878 | 2011.02.13 | 8 | N21W06 | 0000 | AXX |
 |
 |
|||
| S879 | 2011.02.14 | N04W68 | plage | |||||||
| S880 | 2011.02.14 | 2 | N07W41 | 0000 | AXX |
 |
 |
|||
| S881 | 2011.02.15 | S33W62 | plage | |||||||
| S882 | 2011.02.17 | 11 | N18E07 | 0020 | BXI |

|
||||
| Total spot count: | 31 | 90 | ||||||||
| Sunspot number: | 51 | 140 | ||||||||
| Month | Average measured solar flux | International sunspot number (SIDC) | Smoothed sunspot number | Average ap (3) |
|---|---|---|---|---|
| 2008.07 | 65.7 (SF minimum) | 0.5 | 2.8 (-0.4) | |
| 2008.12 | 69.2 | 0.8 | 1.7 (-) sunspot minimum |
3.25 |
| 2009.11 | 73.6 | 4.1 | 7.6 (+0.5) | 2.45 / 2.63 |
| 2009.12 | 76.7 | 10.8 | 8.3 (+0.7) | 1.41 / 1.92 |
| 2010.01 | 81.1 | 13.2 | 9.3 (+1.0) | 2.93 / 3.07 |
| 2010.02 | 84.7 | 18.8 | 10.6 (+1.3) | 4.15 / 4.61 |
| 2010.03 | 83.4 | 15.4 | 12.3 (+1.7) | 4.58 / 4.65 |
| 2010.04 | 75.9 | 8.0 | 14.0 (+1.7) | 10.22 / 10.24 |
| 2010.05 | 73.8 | 8.7 | 15.5 (+1.5) | 9.18 / 8.15 |
| 2010.06 | 72.5 | 13.6 | 16.4 (+0.9) | 8.17 / 6.85 |
| 2010.07 | 79.8 | 16.1 | 16.8 (+0.4) | 6.31 / 5.15 |
| 2010.08 | 79.2 | 19.6 | (17.1 predicted, +0.3) | 8.49 / 7.77 |
| 2010.09 | 81.1 | 25.2 | (17.7 predicted, +0.6) | 5.33 / 5.45 |
| 2010.10 | 81.6 | 23.5 | (19.0 predicted, +1.3) | 6.07 / 6.27 |
| 2010.11 | 82.5 | 21.6 | (20.7 predicted, +1.7) | 4.80 / 5.50 |
| 2010.12 | 84.2 | 14.5 | (22.2 predicted, +1.5) | 3.41 / 4.35 |
| 2011.01 | 83.6 | 19.1 | (23.8 predicted, +1.6) | 4.32 |
| 2011.02 | 92.9 (1) | 31.5 (2A) / 51.8 (2B) | (25.5 predicted, +1.7) | (5.68) |
1) Running average based on the
daily 20:00 UTC observed solar flux
value at 2800 MHz.
2A) Current impact on the monthly sunspot number based on the Boulder (NOAA/SWPC) sunspot number
(accumulated daily sunspots / month days). The official SIDC international sunspot number is typically
30-50% lower. 2B) Month average to date.
3) Running average based on the preliminary
daily SWPC ap indices. Values in red are based on
the
official NGDC ap indices.
This report has been prepared by Jan Alvestad. It is based on analysis of data from whatever sources are available at the time the report is prepared. All time references are to the UTC day. Comments and suggestions are always welcome.
SDO images are courtesy of NASA/SDO and the AIA, EVE, and HMI science teams.
