
The geomagnetic field was quiet on April 23. The high latitude magnetometer at Andenes recorded quiet to active levels. The above 10 MeV proton flux was at background levels at the end of the day.
Solar flux density measured at 20h UT on 2.8 GHz was 219.1 - increasing 44.5 over the previous solar rotation. (Centered 1 year average SF at 1 AU - 183 days ago: 158.40. In comparison SC24 peaked on June 28, 2014 at 145.50. Current SC25 peak: 158.71 on June 27, 2023). The Potsdam WDC planetary A index was 6 (STAR Ap - based on the mean of three hour interval ap indices: 6.1). Three hour interval K indices: 21221122 (planetary), 11223332 (Boulder), 22133144 (Andenes).
The background x-ray flux is at the class C3 level (GOES 16).
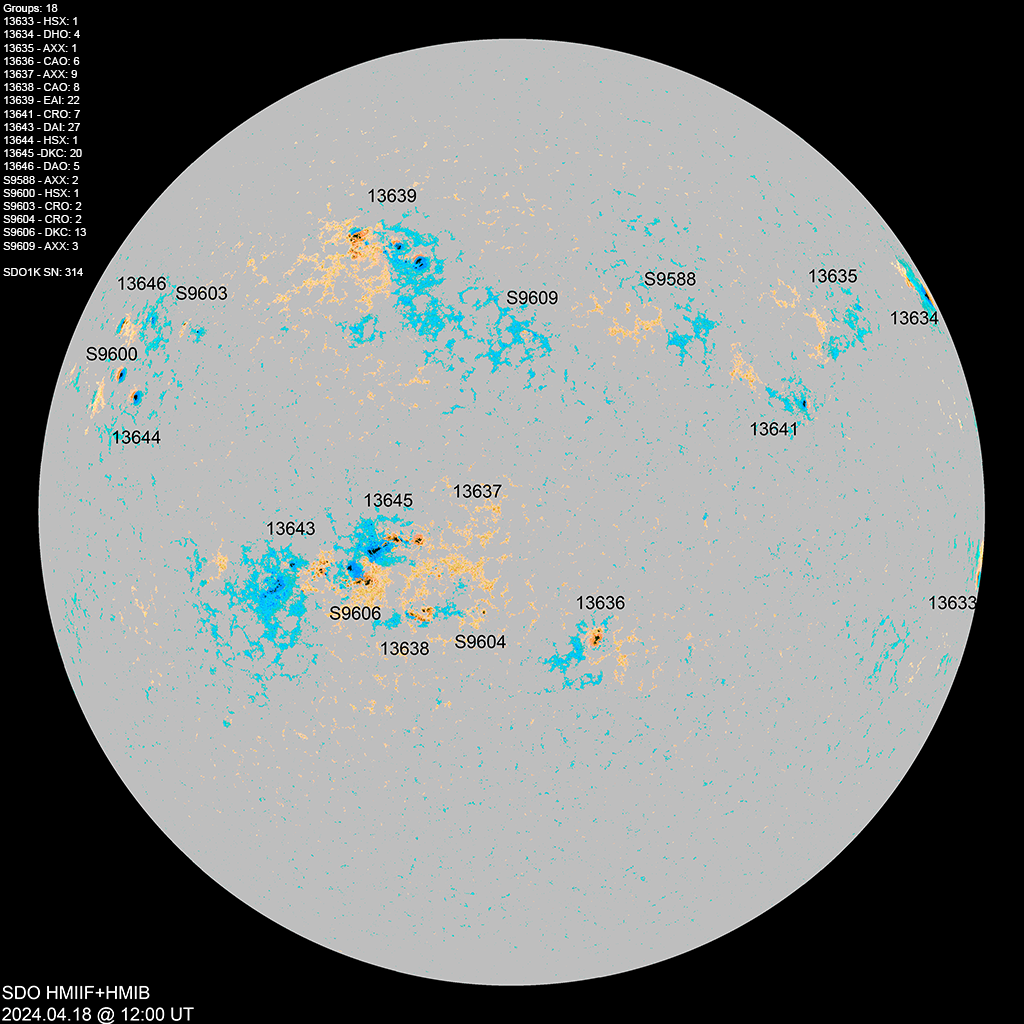
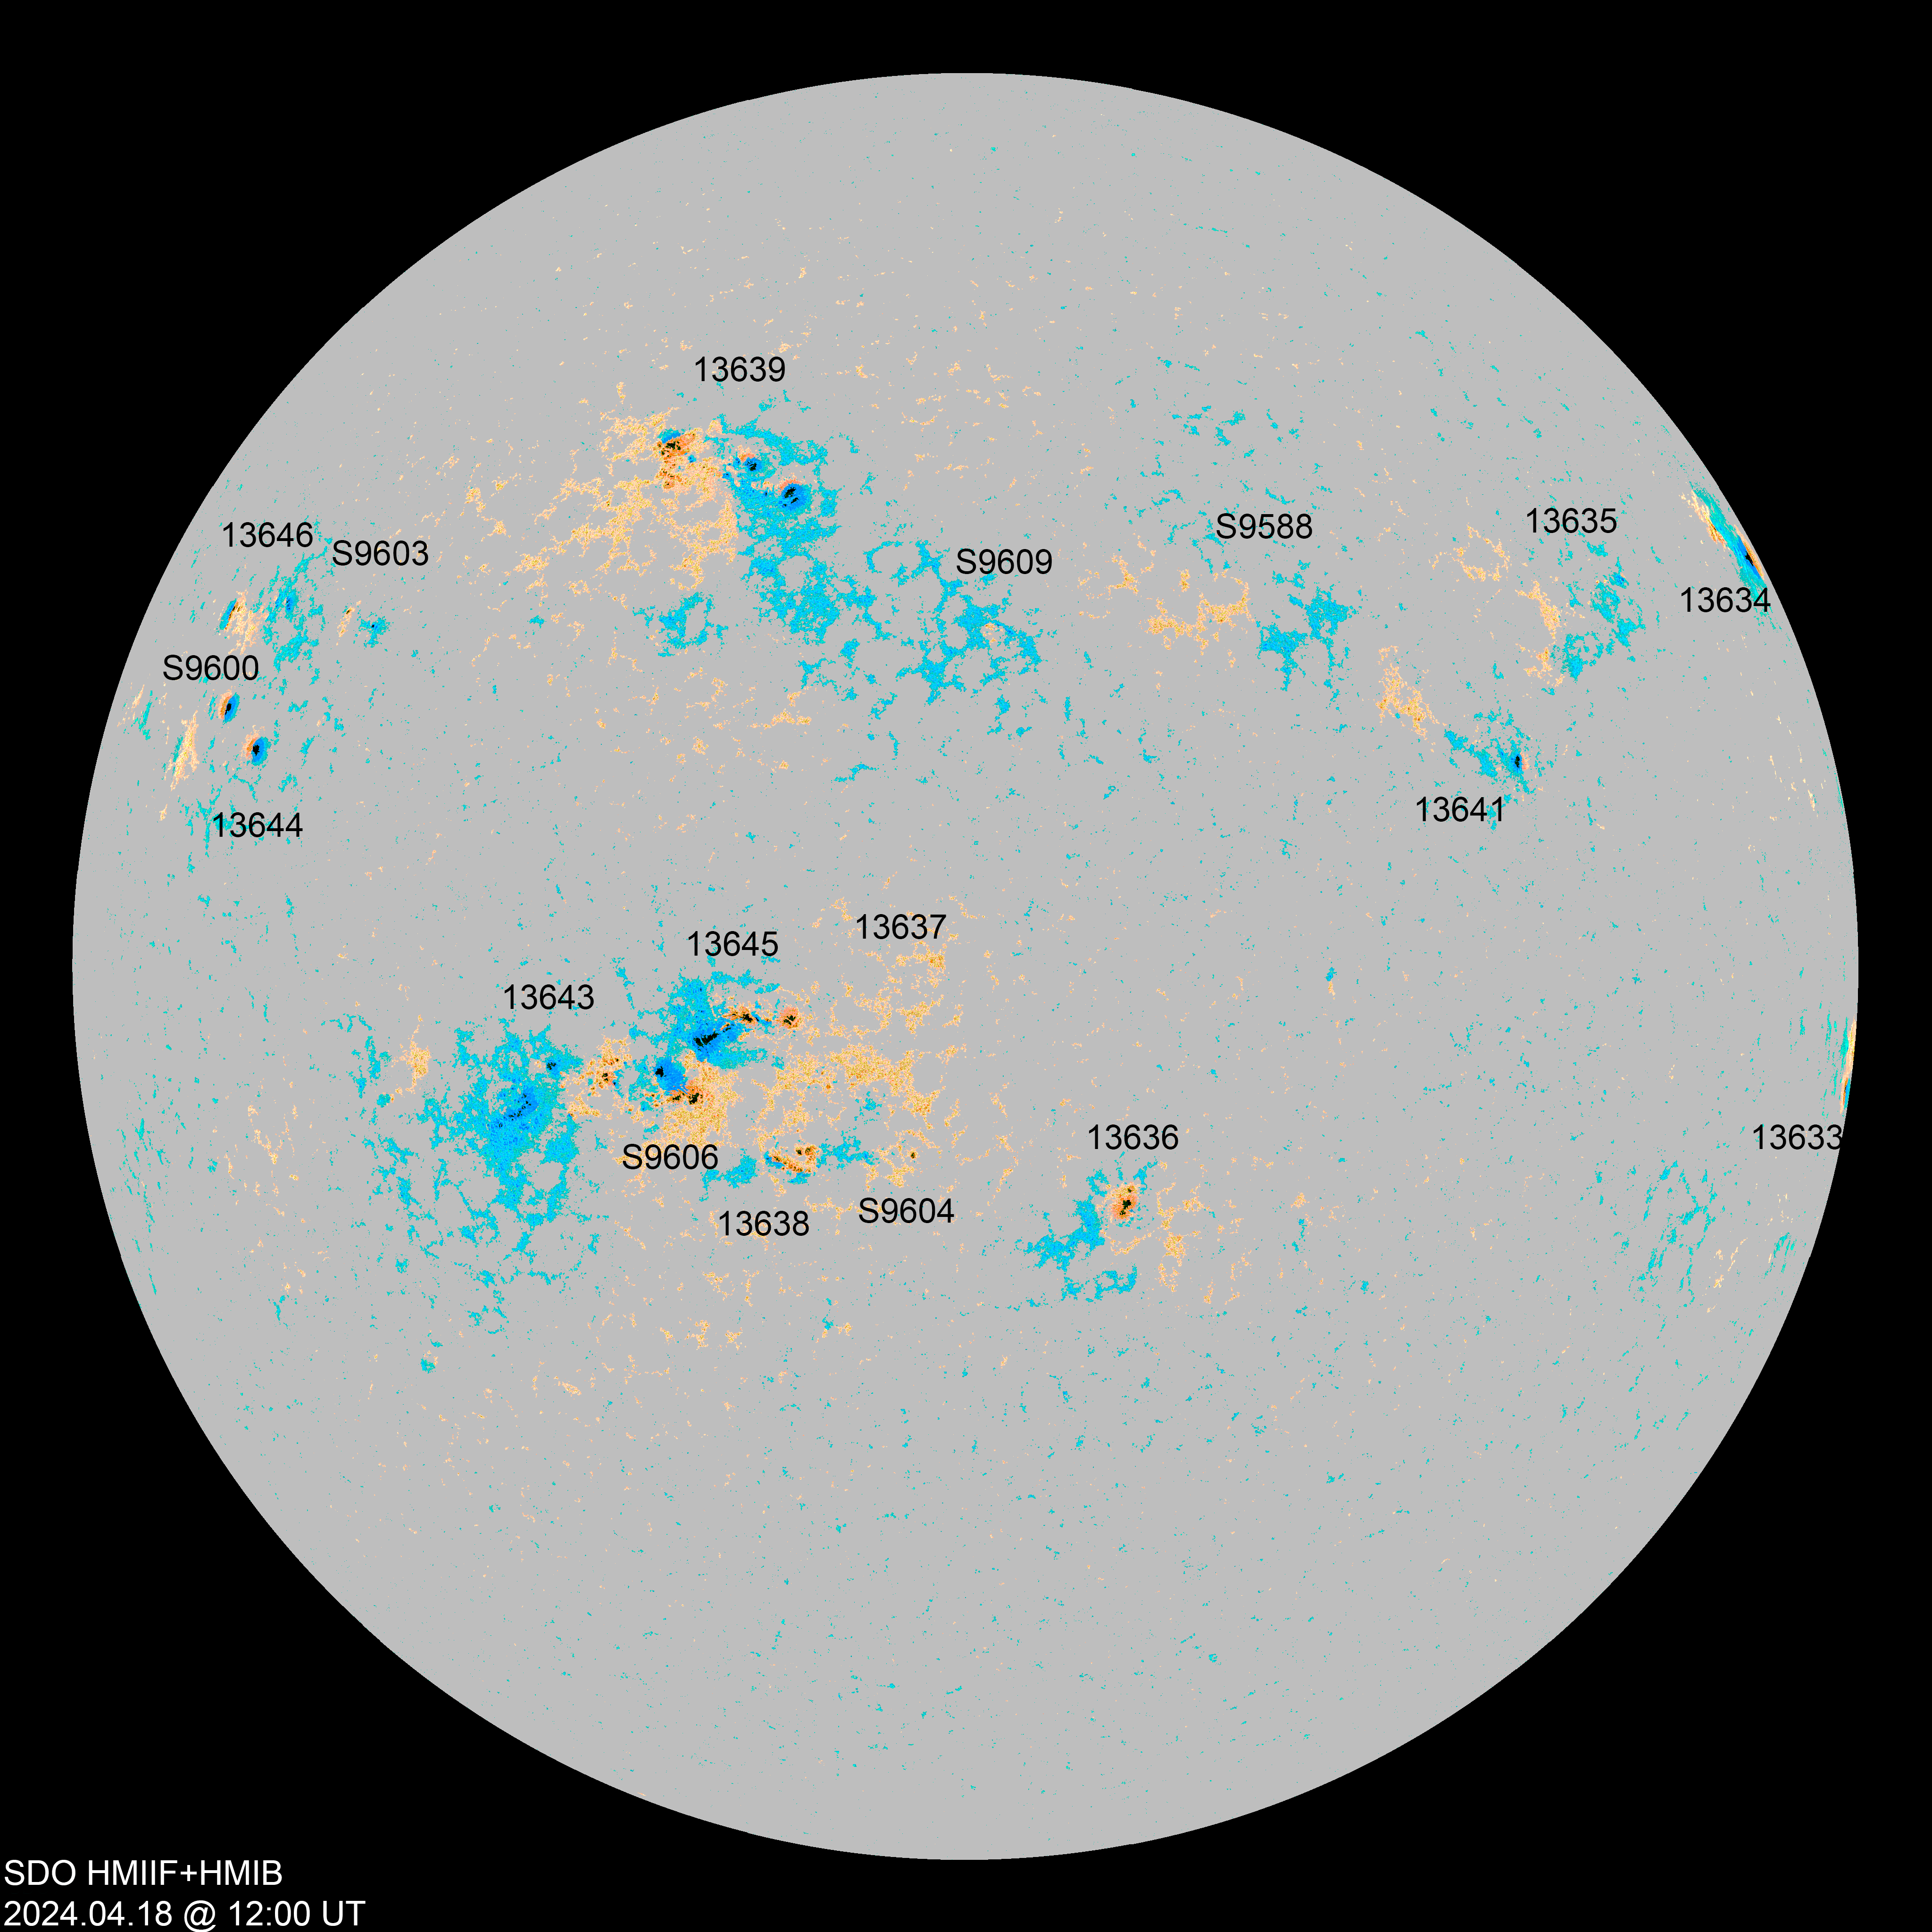
At the time of counting spots (see image time), spots were observed in 22 active regions using 2K resolution (SN: 505) and in 20 active regions using 1K resolution (SN: 362) SDO/HMI images.
Region 13638 [S18W63] decayed slowly and still
has weak polarity intermixing.
Region 13639 [N28W53] decayed slowly and quietly.
Region 13643 [S11W51] developed slowly and still has a magnetic delta
structure in the central spot section.
Region 13644 [N12W19] was quiet and stable.
Region 13645 [S08W63] decayed slowly and produced several flares.
Region 13646 [N21W11] decayed and lost the magnetic delta. The region
still has minor polarity intermixing and could produce M class flares.
Region 13647 [S13W58] decayed slowly and was mostly quiet.
Region 13648 [N18W29] developed further and has polarity intermixing.
Region 13649 [N17W76] decayed slowly and quietly.
Region 13650 [S11W34] decayed slowly and was mostly quiet.
Region 13652 [N14W00] was mostly quiet and stable.
Region 13653 [N02E29] was quiet and stable.
Region 13654 [S07E30] matured somewhat in the northern spot section.
The southern spot section might be a separate spot group.
Region 13655 [S27E37] matured and was quiet.
Region 13656 [S12E49] was mostly quiet and stable
Region 13657 [S12E17] was quiet and stable.
Spotted regions not observed (or interpreted
differently) by SWPC/USAF:
S9600 [N14W13] was quiet and stable.
S9621 [S22W20] was quiet and stable.
S9622 [S17E02] was quiet and stable.
New region S9627 [S14E23] emerged with several
spots and could soon become capable of producing an M class flare. The
region has polarity intermixing.
New region S9628 [N19E18] emerged with tiny spots.
New region S9629 [S04E05] emerged with a tiny
spot.
C2+ flares
| Magnitude | Peak time (UT) | Location | Source | Recorded by | Comment |
| C6.1 | 00:26 | 13646 | GOES16 | ||
| C5.0 | 00:42 | 13638 | GOES16 | ||
| C4.4 | 01:22 | 13638 | GOES16 | simultaneous flare in AR 13645 | |
| C4.4 | 01:33 | 13645 | GOES16 | ||
| C4.9 | 01:46 | 13654 | GOES16 | ||
| C3.8 | 02:42 | 13645 | GOES16 | ||
| M3.6 | 03:19 | 13654 | GOES16 | ||
| M1.3 | 03:42 | 13645 | GOES16 | simultaneous flare in AR 13646 | |
| C6.1 | 04:17 | 13645 | GOES16 | ||
| C5.8 | 04:22 | 13645 | GOES16 | ||
| C3.7 | 05:06 | 13645 | GOES16 | ||
| C3.5 | 05:31 | 13654 | GOES16 | ||
| C3.5 | 05:46 | 13654 | GOES16 | ||
| C3.4 | 05:58 | 13646 | GOES16 | simultaneous flare in AR 13645 | |
| C2.9 | 06:36 | 13645 | GOES16 | ||
| C3.5 | 07:04 | S22W58 | 13638 | GOES16 | incorrectly attributed to AR 13636 by SWPC |
| C5.4 | 07:41 | 13654 | GOES16 | incorrectly attributed to AR 13638 by SWPC | |
| M3.0/1B | 08:21 | 13654 | GOES16 | simultaneous flare in AR 13638 | |
| C3.5 | 09:37 | 13645 | GOES16 | ||
| C4.6 | 09:51 | 13638 | GOES16 | ||
| C4.4 | 10:09 | 13645 | GOES16 | ||
| C4.4 | 10:56 | 13645 | GOES16 | ||
| C4.1 | 11:16 | 13645 | GOES16 | ||
| C3.9 | 11:34 | 13654 | GOES16 | ||
| C4.1 | 11:48 | 13645 | GOES16 | ||
| C5.0 | 12:45 | 13646 | GOES16 | simultaneous flares in ARs 13654 and 13643 | |
| C7.8/1N | 13:43 | S07E39 | 13654 | GOES16 | |
| C6.8 | 14:02 | 13652 | GOES16 | ||
| C4.4 | 14:47 | 13646 | GOES16 | ||
| C7.4 | 15:51 | 13643 | GOES16 | ||
| C6.9 | 16:12 | S9627 | GOES16 | simultaneous flare in AR 13645 | |
| M1.0 | 16:51 | 13654 | GOES16 | ||
| C9.7 | 17:01 | 13643 | GOES16 | simultaneous flare in AR 13645 | |
| M2.9/1N | 17:44 | S18W59 (SDO/AIA) | 13638 | GOES16 | SWPC attributes this to smaller simultaneous flare in AR 13645 (S09W58) |
| C7.1 | 18:08 | 13638 | GOES16 | ||
| C6.5 | 18:30 | 13650 | GOES16 | ||
| C8.9 | 18:42 | 13645 | GOES16 | ||
| C4.8 | 19:15 | 13654 | GOES16 | ||
| C3.6 | 20:16 | 13643 | GOES16 | ||
| C4.2 | 20:59 | 13643 | GOES16 | ||
| C7.4/1F | 21:11 | S05W59 | 13645 | GOES16 | |
| C6.8 | 21:39 | S9627 | GOES16 | ||
| C6.2 | 22:54 | 13646 | GOES16 | ||
| C4.4 | 23:51 | 13638 | GOES16 |
April 22-23: No obviously Earth directed CMEs were observed.
April 21: A faint CME was observed after the M3.4 flare in AR 13638
late in the day. It is uncertain if this CME has any Earth directed components,
however, there is a slight chance of CME effects on February 24-25.
[Coronal hole history (since October 2002)]
[Compare today's report to the situation one solar rotation ago:
28 days ago
27 days ago
26 days ago]
A recurrent trans equatorial coronal hole (CH1215) was Earth facing on April 22-23.

Long distance low and medium frequency (below 2 MHz) propagation along paths north of due west over upper middle and high latitudes is poor. Propagation on long distance northeast-southwest paths is poor.
The geomagnetic field is expected to be quiet on April 24. April 25-26 could see quiet to minor storm conditions due to effects from CH1215.
| Coronal holes (1) | Coronal mass ejections (2) | M and X class flares (3) |
1) Effects from a coronal hole
could reach Earth within the next 5 days. When the high speed
stream has arrived the color changes to green.
2) Effects from a CME are likely to be observed at Earth within 96 hours.
3) There is a possibility of either M or X class flares within the next 48 hours.
Green: 0-30% probability, Yellow: 30-70% probability, Red: 70-100% probability.

(Click on image for 2K resolution).
4K resolution.
Compare to the previous
day's image. 0.5K image
When available the active region map has a coronal hole polarity overlay where red (pink) is negative and blue is positive.
Data for all officially numbered solar regions according to the Solar Region Summary provided by NOAA/SWPC, all other regions are numbered sequentially as they emerge using the STAR spot number. Comments are my own, as is the STAR spot count (spots observed at or inside a few hours before midnight) and data for regions not numbered by SWPC or where SWPC has observed no spots. SWPC active region numbers in the table below and in the active region map above are the historic SWPC/USAF numbers. SWPC data considered to be not sufficiently precise (location, area, classification) are colored red.
| Active region | SWPC date numbered STAR detected |
Spot count | Location at midnight | Area | Classification | SDO / HMI 4K continuum image with magnetic polarity overlays |
Comment | ||||
|---|---|---|---|---|---|---|---|---|---|---|---|
| SWPC/ USAF |
Magnetic (SDO) |
SWPC | STAR | Current | Previous | ||||||
| 2K | 1K | ||||||||||
| 13636 | 2024.04.10 2024.04.11 |
S21W84 | |||||||||
| 13637 | 2024.04.12 2024.04.13 |
S13W69 | |||||||||
| 13638 | 2024.04.12 2024.04.13 |
10 | 17 | 7 | S18W65 | 0010 | BXO | DRI |
 |
 |
beta-gamma location: S18W63 area: 0040 |
| 13639 | 2024.04.13 2024.04.14 |
9 | 12 | 6 | N28W58 | 0160 | EAI | EAO |
 |
 |
location: N28W53 |
| 13640 | 2024.04.14 | N21W55 | |||||||||
| 13643 | 2024.04.15 | 6 | 35 | 22 | S13W46 | 0010 | BXO | DAI |
 |
 |
beta-delta location: S11W51 area: 0210 |
| 13644 | 2024.04.16 2024.04.16 |
6 | 4 | 2 | N13W18 | 0080 | DAO | HSX |
 |
 |
location: N12W19 area: 0050 |
| 13646 | 2024.04.16 2024.04.17 |
18 | 26 | 17 | N21W15 | 0200 | DAI | EAI |
 |
 |
beta-gamma locaton: N21W11 area: 0280 |
| S9600 | 2024.04.16 | 6 | 3 | N14W13 | 0070 | CAO |
 |
 |
|||
| 13650 | 2024.04.16 2024.04.19 |
12 | 17 | 9 | S11W37 | 0110 | CAI | BXO |
 |
 |
location: S11W34 area: 0030 |
| 13648 | 2024.04.17 2024.04.18 |
5 | 19 | 15 | N18W30 | 0010 | BXO | DRI |
 |
 |
beta-gamma area: 0100 location: N18W29 |
| 13645 | 2024.04.17 2024.04.17 |
17 | 23 | 13 | S08W64 | 0250 | DKC | EKI |
 |
 |
beta-gamma area: 0440 location: S08W63 |
| 13647 | 2024.04.17 2024.04.18 |
20 | 19 | 11 | S13W58 | 0190 | DAC | DAI |
 |
 |
area: 0230 |
| 13649 | 2024.04.18 2024.04.19 |
3 | 3 | 1 | N16W81 | 0020 | CSO | BXO |
 |
 |
location: N17W76 area: 0008 |
| 13651 | 2024.04.18 2024.04.19 |
N15W31 | location: N12W26 | ||||||||
| S9612 | 2024.04.19 2024.04.21 |
S20E18 | |||||||||
| 13657 | 2024.04.19 | 1 | 5 | 4 | S12E17 | 0010 | BXO | CRO |
 |
 |
|
| 13652 | 2024.04.19 2024.04.20 |
5 | 17 | 12 | N15E02 | 0120 | DSO | DAO |
 |
 |
area: 0150 locaton: N14W00 |
| S9615 | 2024.04.19 | S33W36 | |||||||||
| 13654 | 2024.04.20 2024.04.21 |
13 | 28 | 16 | S08E31 | 0160 | DAI | DAI |
 |
 |
beta-gamma location: S08E46 two groups? |
| 13653 | 2024.04.20 2024.04.21 |
4 | 2 | N02E30 | 0005 | AXX |
 |
 |
location: N02E29 | ||
| S9618 | 2024.04.20 | N07W36 | |||||||||
| S9619 | 2024.04.20 | N15W57 | |||||||||
| 13655 | 2024.04.21 | 4 | 15 | 7 | S28E36 | 0130 | DAO | DAO |
 |
 |
location: S27E37 area: 0170 |
| 13656 | 2024.04.21 2024.04.21 |
3 | 8 | 5 | S12E46 | 0010 | CRO | CRO |
 |
 |
location: S12E49 area: 0025 |
| S9621 | 2024.04.22 | 4 | 2 | S22W20 | 0010 | CRO |
 |
 |
|||
| S9622 | 2024.04.22 | 5 | S17E02 | 0008 | AXX |
 |
 |
||||
| S9623 | 2024.04.22 | S44W28 |
 |
reversed polarities |
|||||||
| S9625 | 2024.04.23 | S43E17 |
 |
reversed polarities | |||||||
| S9626 | 2024.04.23 | S00E43 |
 |
trans equatorial spots | |||||||
| S9627 | 2024.04.23 | 15 | 7 | S14E23 | 0060 | DRI |
 |
beta-gamma | |||
| S9628 | 2024.04.23 | 2 | N19E18 | 0002 | BXO |
 |
|||||
| S9629 | 2024.04.23 | 1 | 1 | S04E05 | 0003 | AXX |
 |
||||
| Total spot count: | 132 | 285 | 162 | ||||||||
| Sunspot number: | 282 | 505 | 362 | (total spot count + 10 * number of spotted regions) | |||||||
| Weighted SN: | 190 | 358 | 235 | (Sum of total spot count + classification weighting for each AR. Classification weighting: X=0, R=3, A/S=5, H/K=10) | |||||||
| Relative sunspot number (Wolf number): | 310 | 278 | 290 | ||||||||
| Month | Average solar flux | International sunspot number (WDC-SILSO) |
Smoothed sunspot number (4) | Average ap (3) |
|
|---|---|---|---|---|---|
| Measured | 1 AU | ||||
| 2014.02 | 170.3 (cycle peak) |
166.3 | 146.1 (SC24 peak) | 110.5 | 10.70 |
| 2014.04 | 143.9 | 144.8 | 112.5 | 116.4 (SC24 solar max) | 7.88 |
| 2017.09 | 91.3 | 92.3 | 43.6 | 18.2 (-1.3) | 18.22 (SC24 peak) |
| 2019.11 | 70.2 | 68.7 | 0.5 | 2.0 (-0.6) (Solar minimum using 365d smoothing: November 17, 2019) |
4.19 |
| 2019.12 | 70.8 | 68.6 | 1.6 | 1.8 (-0.2) (ISN 13 months smoothed solar minimum) |
3.22 |
| 2022.09 | 135.1 | 136.5 | 96.0 | 96.5 (+3.9) | 12.18 |
| 2022.10 | 133.5 | 132.7 | 95.5 | 98.9 (+2.4) | 11.16 |
| 2022.11 | 123.4 | 120.7 | 80.5 | 101.2 (+2.3) | 9.33 |
| 2022.12 | 147.9 | 143.4 | 112.8 | 106.7 (+5.5) | 10.99 |
| 2023.01 | 182.4 | 176.6 | 144.4 | 113.3 (+6.6) | 8.73 |
| 2023.02 | 167.2 | 163.2 | 111.3 | 117.8 (+3.5) | 14.48 (current SC25 peak) |
| 2023.03 | 157.2 | 155.6 | 123.3 | 121.1 (+3.3) | 14.42 |
| 2023.04 | 145.4 | 146.4 | 97.6 | 122.9 (+1.8) | 13.40 |
| 2023.05 | 155.6 | 159.2 | 137.4 | 124.1 (+1.2) | 10.67 |
| 2023.06 | 161.7 | 166.8 | 160.5 | 125.2 (+1.1) (SC25 solar max candidate) |
8.95 |
| 2023.07 | 176.4 | 182.2 | 160.0 | 124.3 (-0.9) | 8.15 |
| 2023.08 | 153.7 | 157.6 | 114.8 | 124.0 (-0.3) | 7.19 |
| 2023.09 | 154.4 | 156.0 | 134.2 | 123.8 (-0.2) | 14.26 |
| 2023.10 | 142.8 | 141.9 | 99.4 | (123.8 projected, 0.0) | 8.16 |
| 2023.11 | 153.5 | 150.2 | 105.4 | (123.5 projected, -0.3) | 12.20 |
| 2023.12 | 151.1 | 146.4 | 114.2 | (120.1 projected, -3.4) | 9.60 |
| 2024.01 | 164.6 | 159.3 | 123.0 | (116.8 projected, -3.3) | 5.46 |
| 2024.02 | 172.5 | 168.3 | 124.6 | (116.0 projected, -0.8) | 5.31 |
| 2024.03 | 154.4 | 152.9 | 104.9 | (115.4 projected, -0.6) | 11.03 |
| 2024.04 | 163.6 (1) | 106.1 (2A) / 138.3 (2B) / 149.3 (2C) | (115.4 projected, -0.0) | (10.0) | |
| 2024.05 | (116.6 projected, +1.2) | ||||
| 2024.06 | (115.8 projected, -0.8) | ||||
| 2024.07 | (114.1 projected, -1.7) | ||||
| 2024.08 | (112.1 projected, -2.0) | ||||
| 2024.09 | (110.9 projected, -1.2) | ||||
| 2024.10 | (110.3 projected, -0.6) | ||||
1) Running average based on the daily 20:00 UTC observed solar flux value at 2800 MHz
and any corrections applied to that measurement.
2A) Current impact on the monthly sunspot number based on the Boulder (NOAA/SWPC) sunspot number (accumulated daily sunspots / month days).
2B) Boulder SN current month average to date.
2C) STAR SDO 1K Wolf number 30 day average.
3) Running average based on the quicklook and definitive Potsdam WDC ap indices. Values in red
are based on the definitive international
GFZ Potsdam WDC ap indices.
4) Source: WDC-SILSO, Royal Observatory
Of Belgium, Brussels
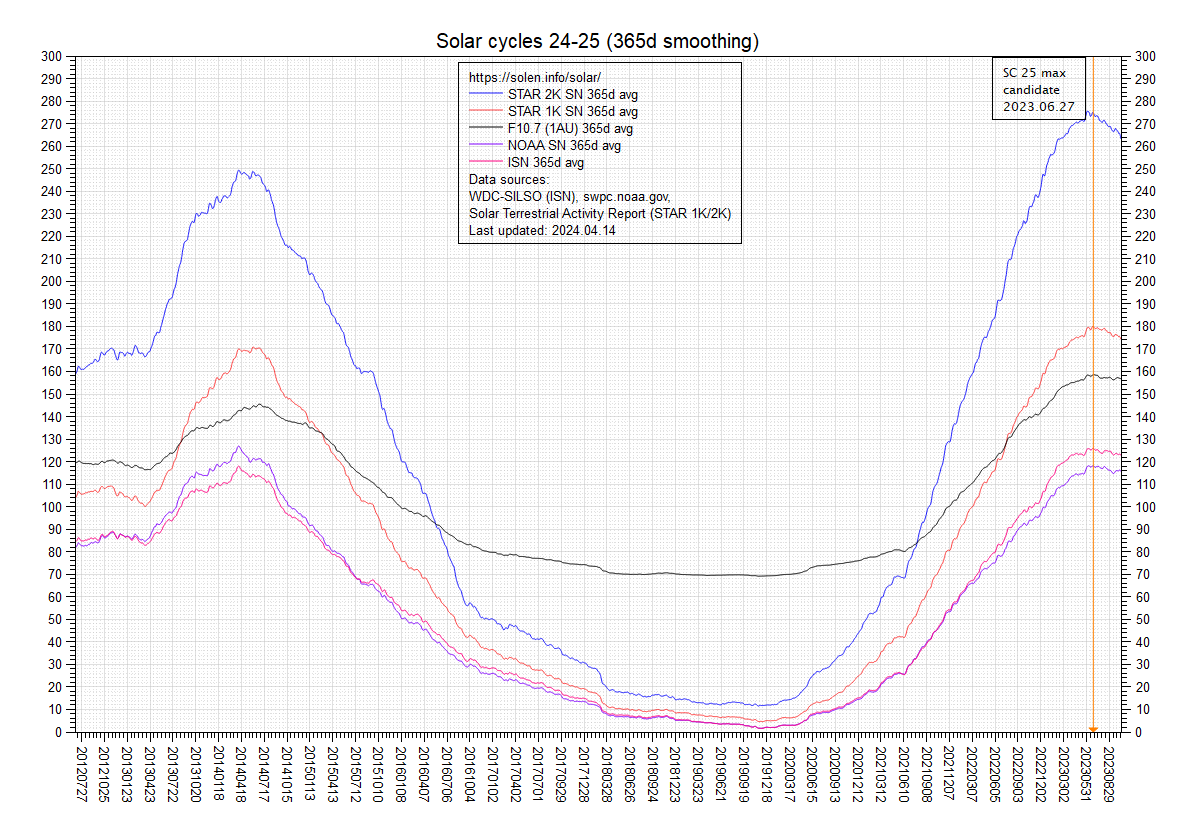
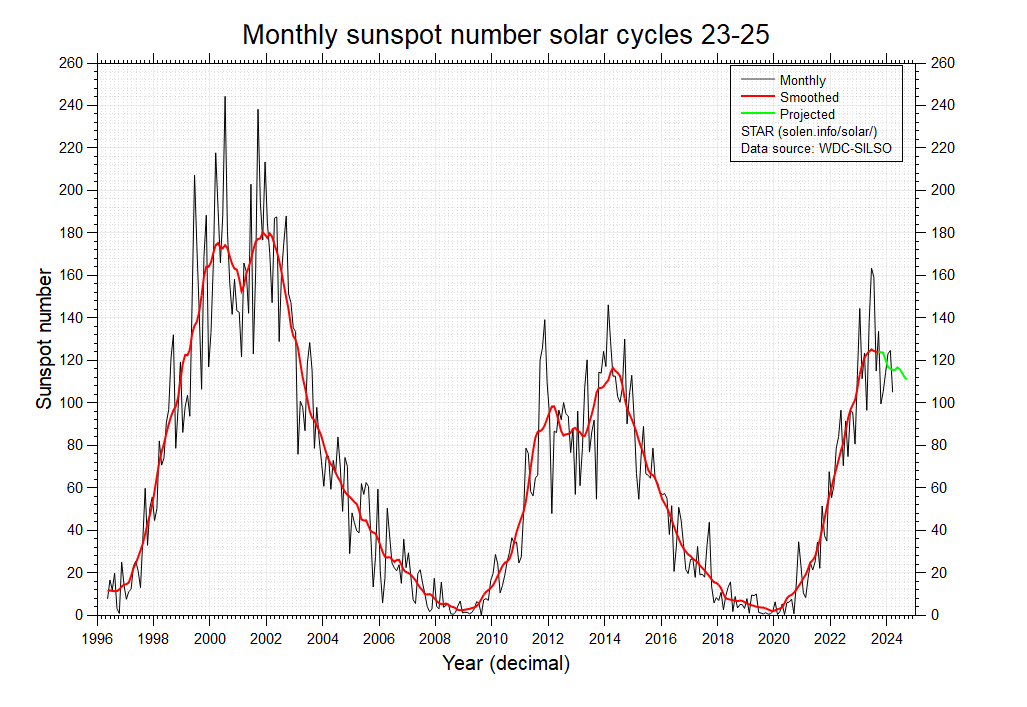
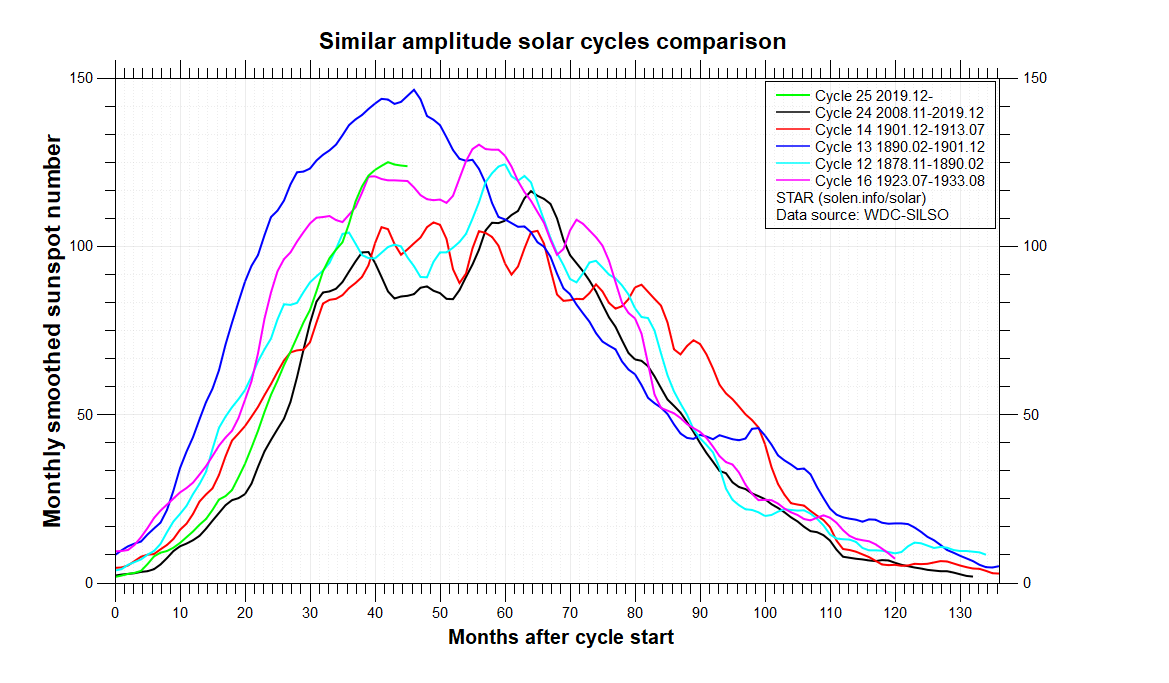
Solar activity saw a significant decrease during the latter half of February and the first part of March. While there is still a chance that there could be another and higher peak in October or November 2023, chances that June 2023 was solar max has increased. After November 2023 there is currently no other obvious candidate solar max month. Taking into account the state of the solar polar fields another major peak during SC25 is becoming less likely.
--------------------------------------------------------------------------------------
This report has been prepared by Jan Alvestad. It is based on the analysis of data from whatever sources are available at the time the report is prepared. All time references are to Universal Time. Comments and suggestions are always welcome.
SDO images are courtesy of NASA/SDO and the AIA, EVE, and HMI science teams.