
Last update issued on April 26, 2003 at 03:50 UTC.
[Solar and geomagnetic data - last 4 weeks (updated daily)]
[Solar wind and electron fluence charts (updated daily)]
[Solar cycles 21-23 (last update April 2, 2003)]
[Solar cycles 1-20]
[Graphical comparison of cycles 21, 22 and 23 (last update April 2, 2003)]
[Graphical comparison of cycles 10, 13, 17, 20 and 23 (last update April 2, 2003)]
[Historical solar and geomagnetic data charts 1954-2003 (last update April 13, 2003)]
[Archived reports (last update April 21, 2003)]
The geomagnetic field was unsettled to minor storm on April 25. Solar wind speed ranged between 467 and 595 km/sec under the influence of a high speed stream from coronal hole CH35. This stream appeared to be ending late in the day.
Solar flux measured at 20h UTC on 2.8 GHz was 143.6. The planetary A
index was 32 (STAR Ap - based on the mean of three hour interval ap indices: 32.4).
Three hour interval K indices: 45553435 (planetary), 54444434 (Boulder).
The background x-ray flux is at the class B6 level.
At midnight there were 8 spotted regions on the visible disk. Solar flare activity was moderate. A total of 10 C and 1 M class events was recorded during the day.
Region 10337 decayed further and simplified. The region, having been the largest on the disk just a day ago, had at
midnight been eclipsed by 3 other regions.
Region 10338 decayed further in the leading and trailing spots sections while development continued in the central spot
section. There is now a delta structure in a northern central penumbra and M class flares are likely. Flares:
C1.5 at 01:09, C1.7 at 09:15, C1.5 at 14:16, C2.7 at 17:22, C1.8 at 19:31, C7.5 at 19:53, C6.8 at 20:58, C4.1 at 22:00 and C1.6
beginning at 23:55 UTC and peaking 6 minutes later. Early on April 26 this region has produced 2 M class flares: M2 at 00:57 and
M2.1 at 03:06 UTC.
Region 10342 developed quickly as new positive magnetic flux emerged in the northern part of the dominant negative
polarity field. There could be a magnetic delta structure in the northwestern most penumbra and minor M class flares are possible.
Due to the proximity to region 10338 it is likely that flare activity in one region will spark activity in the other. Flare:
C1.0 at 08:42 UTC. This region was the source of a long duration C6.6 event peaking at 01:51 UTC on April 26.
Region 10343 decayed slightly and was quiet.
Region 10344 developed very quickly early in the day and has already become the largest region on the visible disk. Minor
M class flares are possible even though the current magnetic configuration is not particularly complicated.
Region 10345 developed quickly and has a magnetic delta structure in the large southern penumbra. M class flares are
possible.
Region 10346 was mostly quiet and stable. Flare: M1.2 (associated with a moderate type
II radio sweep) at 05:40 UTC.
Spotted regions not yet numbered by SEC/NOAA:
[S144] A new and small region rotated into view at the southeast limb on April 25. Location at midnight: S12E73.
April 23: A partial halo CME was observed in LASCO images after the M5.1 flare in region 10338 early in the day. The major part of the ejected material was observed off of the northwest limb. While Earth will be outside of the reaches of the main body of the CME, there is a possibility of a minor impact from the southern CME flank on April 25.
April 24: No obviously geoeffective CMEs observed.
April 25: A large CME was observed mainly off of the northeast limb early in the day after an M class event in region 10346. LASCO C3 images indicate that this may have been a full halo CME. In that case a fairly weak impact could be expected on April 28.
Coronal hole history (since late October 2002)
Compare today's report with the situation one solar rotation ago: 28
days ago 27 days ago 26
days ago
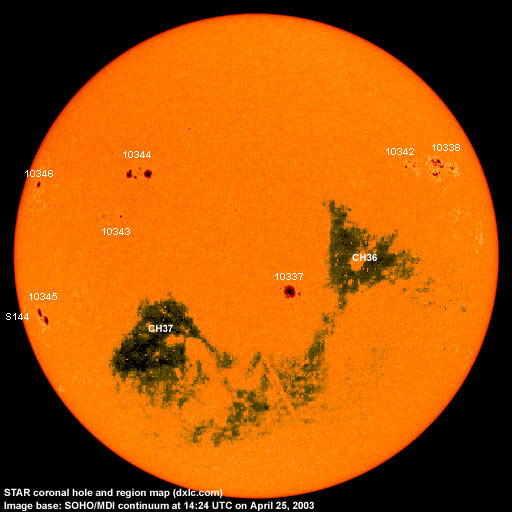
A recurrent trans equatorial coronal hole (CH36) was in a geoeffective position on April 23-24. A recurrent coronal hole (CH37) in the southern hemisphere could rotate into a geoeffective position on April 26-27, CH37 has decreased in size over the last rotation losing its westernmost extensions. CH37 may be located too far to the south to cause any notable geomagnetic disturbance.

Processed SOHO EIT 284 image at 19:06 UTC on April 25. Any black areas on the solar disk are likely coronal holes.
The geomagnetic field is expected to be unsettled to minor storm on April 26-27 due to a high speed stream from CH36. Long distance medium wave (AM) band propagation along east-west paths over high and upper middle latitudes is very poor, a condition which is likely to persist until at least April 29. Propagation along north-south paths is poor to very poor and will likely become poor to fair April 27-29. [Trans Atlantic propagation conditions are currently monitored every night on 1470 kHz. Dominant station tonight: none, only a weak singal from Radio Vibraci�n (Venezuela) noted at times.]
| Coronal holes (1) | Coronal mass ejections (2) | M and X class flares (3) |
1) Effects from a coronal hole could reach Earth within the next 5 days.
2) Material from a CME is likely to impact Earth within 96 hours.
3) There is a possibility of either M or X class flares within the next 48 hours.
Green: 0-20% probability, Yellow: 20-60% probability, Red: 60-100% probability.
Compare to the previous day's image.
Data for all numbered solar regions according to the Solar Region Summary provided by SEC/NOAA. Comments are my own, as is the STAR spot count (spots observed at or inside a few hours before midnight) and data for regions not numbered by SEC or where SEC has observed no spots.
| Solar region | Date numbered | SEC spot count |
STAR spot count |
Location at midnight | Area | Classification | Comment |
|---|---|---|---|---|---|---|---|
| 10336 | 2003.04.17 | 6 | N14W29 | 0010 | BXO | now spotless | |
| 10337 | 2003.04.18 | 18 | 11 | S14W13 | 0270 | DKO | |
| 10338 | 2003.04.19 | 28 | 22 | N18W58 | 0210 | EAO |
gamma-delta classification was EAI at midnight, area 0300 |
| 10340 | 2003.04.21 | S07E00 | plage | ||||
| 10341 | 2003.04.21 | S10E24 | plage | ||||
| 10342 | 2003.04.22 | 9 | 8 | N17W48 | 0040 | CSO |
beta-gamma classification was DAO at midnight, area 0090 |
| 10343 | 2003.04.23 | 6 | 4 | N06E32 | 0020 | CSO | |
| 10344 | 2003.04.24 | 17 | 21 | N16E26 | 0170 | DAO |
classification was DKO at midnight, area 0400 |
| 10345 | 2003.04.24 | 8 | 8 | S17E61 | 0170 | DAO |
beta-delta area was 0280 at midnight |
| 10346 | 2003.04.24 | 1 | 1 | N16E61 | 0060 | HSX | |
| S143 | emerged on 2003.04.23 |
N04W54 | plage | ||||
| S144 | visible on 2003.04.25 |
1 | S12E73 | 0010 | HSX | ||
| Total spot count: | 93 | 76 | |||||
| SSN: | 173 | 156 | |||||
| Month | Average solar flux at Earth |
International sunspot number | Smoothed sunspot number |
|---|---|---|---|
| 2000.04 | 184.2 | 125.5 | 120.8 cycle 23 sunspot max. |
| 2000.07 | 202.3 | 170.1 | 119.8 |
| 2001.12 | 235.1 | 132.2 | 114.6 (-0.9) |
| 2002.03 | 179.5 | 98.4 | 113.3 (-1.3) |
| 2002.04 | 189.8 | 120.7 | 110.5 (-2.9) |
| 2002.05 | 178.4 | 120.8 | 108.8 (-1.7) |
| 2002.06 | 148.7 | 88.3 | 106.2 (-2.6) |
| 2002.07 | 173.5 | 99.6 | 102.7 (-3.5) |
| 2002.08 | 183.6 | 116.4 | 98.7 (-4.0) |
| 2002.09 | 175.8 | 109.6 | 94.6 (-4.1) |
| 2002.10 | 167.0 | 97.5 | (91.0 predicted, -3.6) |
| 2002.11 | 168.7 | 95.0 | (85.7 predicted, -5.3) |
| 2002.12 | 157.2 | 81.6 | (81.3 predicted, -4.4) |
| 2003.01 | 144.0 | 79.5 | (78.3 predicted, -3.0) |
| 2003.02 | 124.5 | 46.2 | (73.3 predicted, -5.0) |
| 2003.03 | 131.4 | 61.5 | (67.6 predicted, -5.7) |
| 2003.04 | 121.3 (1) | 82.6 (2) | (62.7 predicted, -4.9) |
1) Running average based on the daily 20:00 UTC observed solar flux value at 2800 MHz.
2) Unofficial, accumulated value based on the Boulder (SEC/NOAA) sunspot number. The official international sunspot number is typically 25-45% less.
This report has been prepared by Jan Alvestad. It is based partly on my own observations and interpretations, and partly on data from sources noted in solar links. All time references are to the UTC day. Comments and suggestions are always welcome.
| [DX-Listeners' Club] |