
Last update issued on April 28, 2003 at 02:30 UTC.
[Solar and geomagnetic data - last 4 weeks (updated daily)]
[Solar wind and electron fluence charts (updated daily)]
[Solar cycles 21-23 (last update April 2, 2003)]
[Solar cycles 1-20]
[Graphical comparison of cycles 21, 22 and 23 (last update April 2, 2003)]
[Graphical comparison of cycles 10, 13, 17, 20 and 23 (last update April 2, 2003)]
[Historical solar and geomagnetic data charts 1954-2003 (last update April 13, 2003)]
[Archived reports (last update April 21, 2003)]
The geomagnetic field was unsettled to active on April 27. Solar wind speed ranged between 429 and 552 km/sec under the influence of a weaker than expected high speed stream from coronal hole CH36.
Solar flux measured at 20h UTC on 2.8 GHz was 154.1. The planetary A
index was 15 (STAR Ap - based on the mean of three hour interval ap indices: 15.3).
Three hour interval K indices: 34333433 (planetary), 34213433 (Boulder).
The background x-ray flux is at the class B6 level.
At midnight there were 8 spotted regions on the visible disk. Solar flare activity was moderate. A total of 11 C and 1 M class events was recorded during the day.
Region 10337 decayed within the large penumbra while some new spots emerged north and south of that penumbra.
(Region 10338 decayed further and rotated out of view at the end of the day. While there is still a chance of an M class
flare the region is not any longer as active as it has been over the last several days. Flares:
C9.3 at 00:59, C7.6 at 01:13, C6.7 at 02:36, C6.5 at 03:57, C2.5 at 05:41, C8.1 at 07:40, C3.6 at 08:16, C1.6 at 12:17, M1.7 at
15:32, C2.2 at 16:08 and C1.3 at 21:34 UTC.)
Region 10344 saw some increase in the main penumbral areas. The region simplified with the opposite polarity fields
separating. Unless new flux emerges the region is likely to decay slowly. A minor M class flare is still possible.
Region 10345 did not change much in the spot layout. In magnetograms the positive and negative polarity fields are more
cleanly separated.
Region 10346 was quiet and stable.
Region 10347 decayed and could soon become spotless.
Region 10348 developed slowly adding a few spots. Flare: C1.7 at 13:33 UTC.
Region 10349 developed quickly and became the second largest region on the visible disk. A minor M class flare may be
possible, however, the region does not yet display much complexity in the layout of the magnetic fields.
Spotted regions not yet numbered by SEC/NOAA:
[S145] A new region emerged on April 26 south of region 10337 and developed slowly on April 27. Location at midnight:
S20W40.
April 26-27: No obviously geoeffective CMEs observed.
April 25: A large CME was observed mainly off of the northeast limb early in the day after an M class event in region 10346. LASCO C3 images indicate that this may have been a full halo CME. In that case a fairly weak impact could be expected on April 28.
Coronal hole history (since late October 2002)
Compare today's report with the situation one solar rotation ago: 28
days ago 27 days ago 26
days ago
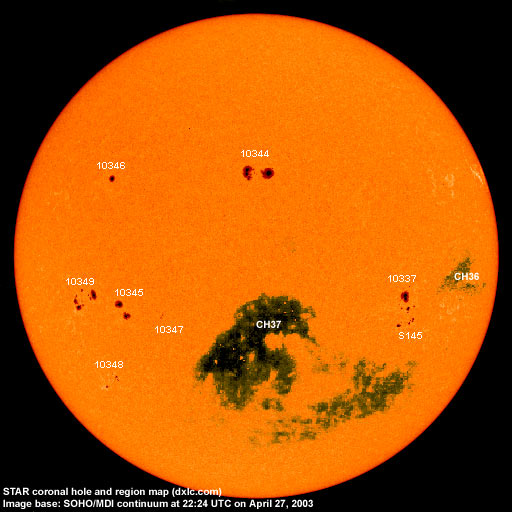
A recurrent trans equatorial coronal hole (CH36) was in a geoeffective position on April 23-24. A recurrent coronal hole (CH37) in the southern hemisphere could rotate into a geoeffective position on April 26-27, CH37 has decreased in size over the last rotation losing its westernmost extensions. CH37 may be located too far to the south to cause any notable geomagnetic disturbance.

Processed SOHO EIT 284 image at 19:06 UTC on April 27. Any black areas on the solar disk are likely coronal holes.
The geomagnetic field is expected to be quiet to active on April 28-30. Long distance medium wave (AM) band propagation along east-west paths over high and upper middle latitudes is very poor, a condition which is likely to persist until at least May 1. Propagation along north-south paths is poor and will likely become poor to fair April 28-30. [Trans Atlantic propagation conditions are currently monitored every night on 1470 kHz. Dominant stations tonight: Radio Cristal del Uruguay and Cadena Peruana de Noticias.]
| Coronal holes (1) | Coronal mass ejections (2) | M and X class flares (3) |
1) Effects from a coronal hole could reach Earth within the next 5 days.
2) Material from a CME is likely to impact Earth within 96 hours.
3) There is a possibility of either M or X class flares within the next 48 hours.
Green: 0-20% probability, Yellow: 20-60% probability, Red: 60-100% probability.
Compare to the previous day's image.
Data for all numbered solar regions according to the Solar Region Summary provided by SEC/NOAA. Comments are my own, as is the STAR spot count (spots observed at or inside a few hours before midnight) and data for regions not numbered by SEC or where SEC has observed no spots.
| Solar region | Date numbered | SEC spot count |
STAR spot count |
Location at midnight | Area | Classification | Comment |
|---|---|---|---|---|---|---|---|
| 10336 | 2003.04.17 | 4 | N14W56 | 0010 | BXO |
spotless since April 25 |
|
| 10337 | 2003.04.18 | 21 | 14 | S14W40 | 0220 | DKI |
beta-gamma classification was DAO at midnight, area 0170 SECs spot count includes region S145 |
| 10338 | 2003.04.19 | 7 | N18W85 | 0200 | DAI | rotated out of view | |
| 10340 | 2003.04.21 | S07W26 | plage | ||||
| 10341 | 2003.04.21 | S10W02 | plage | ||||
| 10342 | 2003.04.22 | 1 | N17W75 | 0030 | HSX | now spotless | |
| 10343 | 2003.04.23 | 5 | N06E05 | 0010 | BXO | now spotless | |
| 10344 | 2003.04.24 | 20 | 22 | N16W00 | 0450 | DKI | |
| 10345 | 2003.04.24 | 6 | 7 | S17E34 | 0190 | DAO | |
| 10346 | 2003.04.24 | 1 | 1 | N16E35 | 0060 | HSX | |
| 10347 | 2003.04.26 | 3 | 4 | S20E22 | 0020 | DRO |
classification was BXO at midnight, area 0010 |
| 10348 | 2003.04.26 | 7 | 11 | S36E44 | 0030 | CSO |
classification was DSO at midnight |
| 10349 | 2003.04.26 | 15 | 23 | S14E46 | 0150 | DAO |
classification was DAI at midnight, area 0230 |
| S143 | emerged on 2003.04.23 |
N04W80 | plage | ||||
| S145 | emerged on 2003.04.26 |
11 | S20W40 | 0060 | DAO | ||
| Total spot count: | 90 | 93 | |||||
| SSN: | 200 | 173 | |||||
| Month | Average solar flux at Earth |
International sunspot number | Smoothed sunspot number |
|---|---|---|---|
| 2000.04 | 184.2 | 125.5 | 120.8 cycle 23 sunspot max. |
| 2000.07 | 202.3 | 170.1 | 119.8 |
| 2001.12 | 235.1 | 132.2 | 114.6 (-0.9) |
| 2002.03 | 179.5 | 98.4 | 113.3 (-1.3) |
| 2002.04 | 189.8 | 120.7 | 110.5 (-2.9) |
| 2002.05 | 178.4 | 120.8 | 108.8 (-1.7) |
| 2002.06 | 148.7 | 88.3 | 106.2 (-2.6) |
| 2002.07 | 173.5 | 99.6 | 102.7 (-3.5) |
| 2002.08 | 183.6 | 116.4 | 98.7 (-4.0) |
| 2002.09 | 175.8 | 109.6 | 94.6 (-4.1) |
| 2002.10 | 167.0 | 97.5 | (91.0 predicted, -3.6) |
| 2002.11 | 168.7 | 95.0 | (85.7 predicted, -5.3) |
| 2002.12 | 157.2 | 81.6 | (81.3 predicted, -4.4) |
| 2003.01 | 144.0 | 79.5 | (78.3 predicted, -3.0) |
| 2003.02 | 124.5 | 46.2 | (73.3 predicted, -5.0) |
| 2003.03 | 131.4 | 61.5 | (67.6 predicted, -5.7) |
| 2003.04 | 123.4 (1) | 95.7 (2) | (62.7 predicted, -4.9) |
1) Running average based on the daily 20:00 UTC observed solar flux value at 2800 MHz.
2) Unofficial, accumulated value based on the Boulder (SEC/NOAA) sunspot number. The official international sunspot number is typically 25-45% less.
This report has been prepared by Jan Alvestad. It is based partly on my own observations and interpretations, and partly on data from sources noted in solar links. All time references are to the UTC day. Comments and suggestions are always welcome.
| [DX-Listeners' Club] |