
Last major update issued on December 10, 2003 at 04:40 UTC. Minor update posted at 06:58 UTC.
[Solar and geomagnetic data - last month (updated daily)]
[Solar wind and electron fluence charts (updated daily)]
[Solar cycles 21-23 (last update December 2, 2003)]
[Solar cycles 1-20]
[Graphical comparison of cycles 21, 22 and 23 (last update December 2, 2003)]
[Graphical comparison of cycles 2, 10, 13, 17, 20 and 23 (last update December
2, 2003)]
[Historical solar and geomagnetic data charts 1954-2003 (last update October 15, 2003)]
[Archived reports (last update December 8, 2003)]
The geomagnetic field was unsettled to minor storm on December 8. Solar wind speed ranged between 580 and 762 km/sec under the influence of a high speed stream from coronal hole CH71.
Solar flux measured at 20h UTC on 2.8 GHz was 92.2. The planetary A
index was 31 (STAR Ap - based on the mean of three hour interval ap indices: 31.1).
Three hour interval K indices: 34555544 (planetary), 34444434 (Boulder).
The background x-ray flux is at the class B1 level.
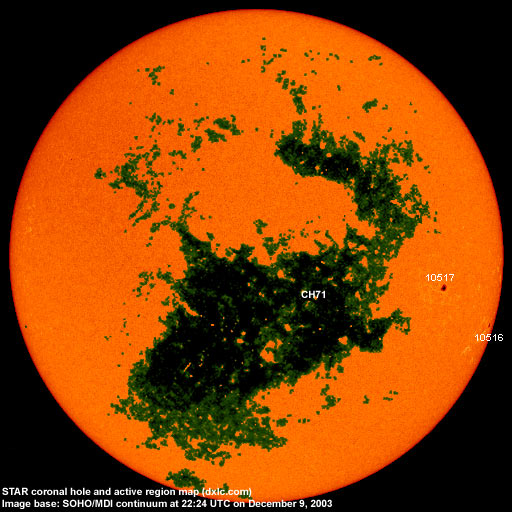
At midnight there were 2 spotted regions on the visible disk. Solar flare activity was very low.
Region 10516 decayed slowly and will rotate over the southwest limb today.
Region 10517 decayed and lost all trailing spots.
Comment added at 06:58 UTC: Two new regions are rotating into view at the east limb, one is located at S10E80 while the other one is at N03E80. Both appear to be simply structured with a penumbral area of approximately 0050 millionths.
December 7-9: No partly or fully earth directed CMEs observed.
Coronal hole history (since late October 2002)
Compare today's report with the situation one solar rotation ago: 28
days ago 27 days ago 26 days ago
A huge recurrent trans equatorial coronal hole (CH71) will be in a geoeffective position on December 5-11. Some decay was observed in the northern and western parts on December 9.

Processed SOHO/EIT 284 image at 19:14 UTC on December 9. The darkest areas on the solar disk are likely coronal holes.
The geomagnetic field is expected to be unsettled to minor storm with occasional major storm intervals until December 14 or 15 due to a strong high speed stream from coronal hole CH71.
Long distance low frequency (below 2 MHz) propagation along east-west paths over high and upper middle latitudes is poor. Propagation along long distance north-south paths is fair. [Trans Atlantic propagation conditions are currently monitored every night on 1470 kHz. Dominant stations tonight: Radio Cristal del Uruguay and Radio Rafaela (Argentina). WWZN Boston on 1510 kHz was again noted with a surprisingly good signal (S9+5dB)].
| Coronal holes (1) | Coronal mass ejections (2) | M and X class flares (3) |
1) Effects from a coronal hole could reach Earth within the next 5 days. When the high speed stream has arrived
the color changes to green.
2) Material from a CME is likely to impact Earth within 96 hours.
3) There is a possibility of either M or X class flares within the next 48 hours.
Green: 0-20% probability, Yellow: 20-60% probability, Red: 60-100% probability.
Compare to the previous day's image.
Data for all numbered solar regions according to the Solar Region Summary provided by NOAA/SEC. Comments are my own, as is the STAR spot count (spots observed at or inside a few hours before midnight) and data for regions not numbered by SEC or where SEC has observed no spots. SEC active region numbers in the table below and in the active region map above are the historic SEC/USAF numbers.
| Active region | Date numbered | SEC spot count |
STAR spot count |
Location at midnight | Area | Classification | Comment |
|---|---|---|---|---|---|---|---|
| 10515 | 2003.11.28 | S03W81 | plage | ||||
| 10516 | 2003.11.28 | 1 | 1 | S16W80 | 0050 | HSX |
area was 0030 at midnight |
| 10517 | 2003.11.30 | 2 | 2 | S08W51 | 0060 | HSX |
classification was HAX at midnight, area 0070 |
| 10518 | 2003.12.03 | S21W68 | plage | ||||
| 10519 | 2003.12.04 | S05W84 | plage | ||||
| S320 | emerged on 2003.12.05 |
S08W65 | plage | ||||
| Total spot count: | 3 | 3 | |||||
| SSN: | 23 | 23 | |||||
| Month | Average solar flux at Earth |
International sunspot number | Smoothed sunspot number |
|---|---|---|---|
| 2000.04 | 184.2 | 125.5 | 120.8 cycle 23 sunspot max. |
| 2000.07 | 202.3 | 170.1 | 119.8 |
| 2001.12 | 235.1 | 132.2 | 114.6 (-0.9) |
| 2002.11 | 168.7 | 95.5 | 85.2 (-5.3) |
| 2002.12 | 157.2 | 80.8 | 82.0 (-3.2) |
| 2003.01 | 144.0 | 79.7 | 80.9 (-1.1) |
| 2003.02 | 124.5 | 46.0 | 78.5 (-2.4) |
| 2003.03 | 131.4 | 61.1 | 74.1 (-4.4) |
| 2003.04 | 126.4 | 60.0 | 70.3 (-3.8) |
| 2003.05 | 115.7 | 55.2 | 67.8 (-2.5) |
| 2003.06 | 129.3 | 77.4 | (65.3 predicted, -2.5) |
| 2003.07 | 127.7 | 85.0 | (61.9 predicted, -3.4) |
| 2003.08 | 122.1 | 72.7 | (59.0 predicted, -2.9) |
| 2003.09 | 112.2 | 48.8 | (57.0 predicted, -2.0) |
| 2003.10 | 151.7 | 65.6 | (54.3 predicted, -2.7) |
| 2003.11 | 140.8 | 67.2 | (51.6 predicted, -2.7) |
| 2003.12 | 113.4 (1) | 25.6 (2) | (49.0 predicted, -2.6) |
1) Running average based on the daily 20:00 UTC observed solar flux value at 2800 MHz.
2) Unofficial, accumulated value based on the Boulder (NOAA/SEC) sunspot number. The official international sunspot number is typically
30-50% less.
This report has been prepared by Jan Alvestad. It is based partly on my own observations and analysis, and partly on data from sources noted in solar links. All time references are to the UTC day. Comments and suggestions are always welcome.
| [DX-Listeners' Club] |