
Last update issued on February 4, 2003 at 01:45 UTC.
[Solar and geomagnetic data
- last 4 weeks (updated daily)]
[Solar wind and electron
fluence charts (updated daily)]
[Solar cycles 21-23 (last
update February 2, 2003)]
[Solar cycles 1-20]
[Graphical comparison of
cycles 21, 22 and 23 (last update February 2, 2003)]
[Graphical comparison of
cycles 10, 13, 17, 20 and 23 (last update February 2, 2003)]
[Historical solar and geomagnetic
data charts 1954-2002 (last update January 27, 2003)]
[Archived reports (last update February 3, 2003)]
The geomagnetic field was unsettled to active on February 3. Solar wind speed ranged between 455 and 543 km/sec. A coronal stream began to dominate the solar wind after 07h UTC.
Solar flux measured at 20h UTC on 2.8 GHz was 132.5. The planetary A
index was 19 (STAR Ap - based on the mean of three hour interval ap indices: 20.5).
Three hour interval K indices: 43434433 (planetary), 42433333 (Boulder).
The background x-ray flux is at the class B4 level.
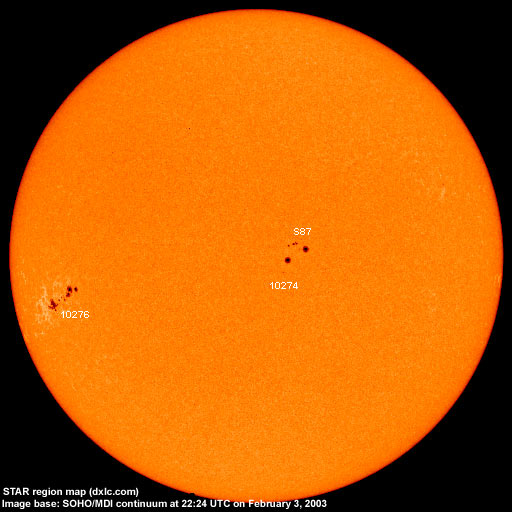
At midnight there were 3 spotted regions on the visible disk, 1 of which has not yet been numbered by SEC/NOAA. Solar flare activity was low. Only 1 C class flare was recorded during the day.
Region 10274 added a few small spots in the southwestern trailing positive polarity area.
Region 10276 developed slowly in the trailing spot section which has a magnetic delta structure in the northern part of
the largest penumbra. Slow decay was noted in the leading spot section. An M class flare is possible. Flare:
C1.0 at 04:56 UTC.
Spotted regions not yet numbered by SEC/NOAA:
[S87] A new region emerged north of region 10274 on January 31. Initially it was not clear if this was a separate region
and the spots were associated with region 10274. The region developed quickly on February 2 and it became obvious that regions
10274 and S87 were separate bipolar regions. Location at midnight: S04W10.
February 1-3: No obviously geoeffective CMEs observed.
Coronal hole history (since late October 2002)
Compare today's report with the situation one solar rotation ago: 28
days ago 27 days ago 26 days ago
A large and well defined trans equatorial extension of the northern polar coronal hole was in a geoeffective position on February 1-3.

Processed SOHO EIT 284 image at 19:06 UTC on January 31. [Due to a CCD bakeout the next image will likely be produced on February 4.] Any black areas on the solar disk are likely coronal holes.
The geomagnetic field is expected to be unsettled to minor storm on February 4-5 and quiet to active on February 6-7 due to a coronal stream. Long distance medium wave (AM) band propagation along east-west paths over high and upper middle latitudes is very poor, propagation along north-south paths is good.
| Coronal holes (1) | Coronal mass ejections (2) | M and X class flares (3) |
1) Effects from a coronal hole could reach Earth within the
next 5 days.
2) Material from a CME is likely to impact Earth within 96 hours.
3) There is a possibility of either M or X class flares within the next 48
hours.
Green: 0-20% probability, Yellow: 20-60% probability, Red: 60-100% probability.
Compare to the previous day's image.
Data for all numbered solar regions according to the Solar Region Summary provided by SEC/NOAA. Comments are my own, as is the STAR spot count (spots observed at or inside a few hours before midnight) and data for regions not numbered by SEC or where SEC has observed no spots.
| Solar region | Date numbered | SEC spot count |
STAR spot count |
Location at midnight | Area | Classification | Comment |
|---|---|---|---|---|---|---|---|
| 10272 | 2003.01.26 | 1 | S04W87 | 0040 | HRX | rotated out of view | |
| 10274 | 2003.01.28 | 13 | 3 | S07W07 (SEC: S05W09) |
0130 | DSO |
classification was CSO at midnight. location corrected. SEC spot count includes that of region S87 |
| 10275 | 2003.01.29 | S11W75 | plage | ||||
| 10276 | 2003.02.01 | 25 | 34 | S14E54 | 0280 | EAI | beta-gamma-delta |
| S84 | emerged on 2003.01.30 |
N11W48 | plage | ||||
| S85 | emerged on 2003.02.01 |
S13W48 | plage | ||||
| S86 | emerged on 2003.02.02 |
S18W22 | now spotless | ||||
| S87 | emerged on 2003.01.31 |
10 | S04W10 | 0080 | DSO |
split off from region 10274 |
|
| Total spot count: | 39 | 47 | |||||
| SSN: | 69 | 77 | |||||
| Month | Average solar flux at Earth |
International sunspot number | Smoothed sunspot number |
|---|---|---|---|
| 2000.04 | 184.2 | 125.5 | 120.8 cycle 23 sunspot max. |
| 2000.07 | 202.3 | 170.1 | 119.8 |
| 2001.12 | 235.1 | 132.2 | 114.6 (-0.9) |
| 2002.01 | 226.6 | 114.1 | 113.5 (-1.1) |
| 2002.02 | 205.0 | 107.4 | 114.6 (+1.2) |
| 2002.03 | 179.5 | 98.4 | 113.3 (-1.3) |
| 2002.04 | 189.8 | 120.7 | 110.5 (-2.9) |
| 2002.05 | 178.4 | 120.8 | 108.8 (-1.7) |
| 2002.06 | 148.7 | 88.3 | 106.2 (-2.6) |
| 2002.07 | 173.5 | 99.6 | 102.7 (-3.5) |
| 2002.08 | 183.6 | 116.4 | (99.7 predicted, -3.0) |
| 2002.09 | 175.8 | 109.6 | (96.7 predicted, -3.0) |
| 2002.10 | 167.0 | 97.5 | (93.2 predicted, -3.5) |
| 2002.11 | 168.7 | 95.0 | (88.0 predicted, -5.2) |
| 2002.12 | 157.2 | 81.6 | (83.6 predicted, -4.4) |
| 2003.01 | 144.0 | 79.5 | (80.6 predicted, -3.0) |
| 2003.02 | 128.3 (1) | 7.3 (2) | (75.5 predicted, -5.1) |
1) Running average based on the daily 20:00 UT observed solar flux value at 2800
MHz.
2) Unofficial, accumulated value based on the Boulder (SEC/NOAA) sunspot number. The official
international sunspot number is typically 25-45% less.
This report has been prepared by Jan Alvestad. It is based partly on my own observations and interpretations, and partly on data from sources noted in solar links. All time references are to the UTC day. Comments and suggestions are always welcome.
| [DX-Listeners' Club] |