
Last update January 10, 2003 at 04:25 UTC.
[Solar and geomagnetic data
- last 4 weeks (updated daily)]
[Solar wind and electron
fluence charts (updated daily)]
[Solar cycles 21-23 (last
update January 1, 2003)]
[Solar cycles 1-20]
[Graphical comparison of
cycles 21, 22 and 23 (last update January 1, 2003)]
[Graphical comparison of
cycles 10, 13, 17, 20 and 23 (last update January 1, 2003)]
[Historical solar and geomagnetic
data charts 1954-2002 (last update October 13, 2002)]
[Archived reports (last update January 6, 2003)]
The geomagnetic field was quiet to unsettled on January 9. Solar wind speed ranged between 277 and 339 km/sec. A weak coronal stream began to dominate the solar wind after 17h UTC and solar wind speed has gradually increased since then.
Solar flux measured at 20h UTC on 2.8 GHz was 182.9. The planetary A
index was 7 (STAR Ap - based on the mean of three hour interval ap indices: 7.9).
Three hour interval K indices: 22112333 (planetary), 11112222 (Boulder).
The background x-ray flux is at the class B8 level.
At midnight there were 9 spotted regions on the visible disk, 1 of which has not yet been numbered. Solar flare activity was moderate. A total of 14 C and 1 M class events were recorded during the day.
Region 10242 decayed losing penumbral area in all sections. The region may still be capable of producing an M
class flare. Flares: C2.3 at 00:39, C9.8/1F at 01:39 and C2.0 at 22:37 UTC.
Region 10244 decayed further and could become spotless late today or tomorrow.
Region 10245 decayed significantly and is quickly heading towards spotlessness.
Region 10247 developed quickly, particularly in the trailing spot section. A major flare is possible. Flares:
C3.4 at 02:53 and C1.6 at 08:49 UTC.
Region 10249 decayed losing both spots and penumbral area.
Region 10250 added a few small spots and was otherwise mostly unchanged. A minor M class flare is possible.
Region 10251 did not change much and still has a magnetic delta structure in the trailing spot section. Further M class
flares are likely. Flares:
C2.4 at 00:31, M1.0/1N at 05:37, C2.6 at 07:52, C2.5 at 13:23, C2.4 at 17:26, C1.7 at 18:23 and C4.3 at 18:50 UTC.
New region 10252 emerged near the southeast limb.
Spotted regions not yet numbered by SEC/NOAA:
[S71] A new region is rotating into view at the southeast limb. Location at midnight: S15E84.
January 7-9: No obviously geoeffective CMEs observed.
Coronal hole history (since late October 2002)
Compare today's report with the situation one solar rotation ago: 28
days ago 27 days ago 26 days ago
No coronal holes are currently approaching geoeffective positions.

Processed SOHO EIT 284 image at 01:06 UTC on January 10. Any black areas on the solar disk are likely coronal holes.
The geomagnetic field is expected to be quiet to active on January 10 and quiet to unsettled on January 11-12. Long distance medium wave (AM) band propagation along east-west paths over high and upper middle latitudes is fair.
| Coronal holes (1) | Coronal mass ejections (2) | M and X class flares (3) |
1) Effects from a coronal hole could reach Earth within the
next 5 days.
2) Material from a CME is likely to impact Earth within 96 hours.
3) There is a possibility of either M or X class flares within the next 48
hours.
Green: 0-20% probability, Yellow: 20-60% probability, Red: 60-100% probability.
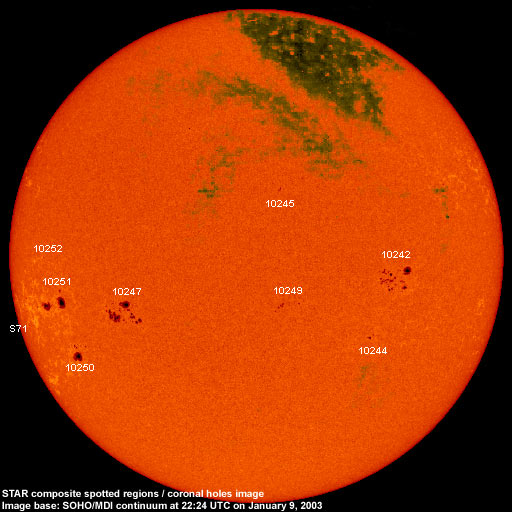
Composite image based on a SOHO/MDI continuum image and overlaid by a coronal hole image. Region numbering has been included. Compare to the previous day's image.
Data for all numbered solar regions according to the Solar Region Summary provided by SEC/NOAA. Comments are my own, as is the STAR spot count (spots observed at or inside a few hours before midnight) and data for regions not numbered by SEC or where SEC has observed no spots.
| Solar region | Date numbered | SEC spot count |
STAR spot count |
Location at midnight | Area | Classification | Comment |
|---|---|---|---|---|---|---|---|
| 10242 | 2003.01.02 | 35 | 28 | S08W34 | 0310 | DAI | beta-gamma |
| 10244 | 2003.01.03 | 7 | 4 | S22W31 | 0030 | CSO | |
| 10245 | 2003.01.03 | 6 | 3 | N12W05 | 0030 | CAO |
classification was HRX at midnight, area 0020 |
| 10246 | 2003.01.06 | N09W28 | plage | ||||
| 10247 | 2003.01.06 | 36 | 46 | S17E34 | 0340 | DAI |
classification was EAI at midnight, area 0550 |
| 10248 | 2003.01.07 | 1 | S10W69 | 0050 | AXX |
now spotless, area was 0020 at most early in the day |
|
| 10249 | 2003.01.07 | 13 | 9 | S15W08 | 0040 | DSO | |
| 10250 | 2003.01.07 | 5 | 9 | S27E53 | 0160 | CAO |
classification was DAO at midnight |
| 10251 | 2003.01.07 | 12 | 15 | S13E58 | 0330 | EAO | beta-gamma-delta |
| 10252 | 2003.01.09 | 1 | 1 | S04E61 | 0010 | AXX | |
| S68 | emerged on 2003.01.04 |
N02W20 | plage | ||||
| S69 | emerged on 2003.01.05 |
N13W51 | plage | ||||
| S71 | visible on 2003.01.09 |
3 | S15E84 | 0100 | CSO | ||
| Total spot count: | 116 | 118 | |||||
| SSN: | 206 | 208 | |||||
| Month | Average solar flux at Earth |
International sunspot number | Smoothed sunspot number |
|---|---|---|---|
| 2000.04 | 184.2 | 125.5 | 120.8 cycle 23 sunspot max. |
| 2000.07 | 202.3 | 170.1 | 119.8 |
| 2001.12 | 235.1 | 132.2 | 114.6 (-0.9) |
| 2002.01 | 226.6 | 114.1 | 113.5 (-1.1) |
| 2002.02 | 205.0 | 107.4 | 114.6 (+1.2) |
| 2002.03 | 179.5 | 98.4 | 113.3 (-1.3) |
| 2002.04 | 189.8 | 120.7 | 110.5 (-2.9) |
| 2002.05 | 178.4 | 120.8 | 108.8 (-1.7) |
| 2002.06 | 148.7 | 88.3 | 106.2 (-2.6) |
| 2002.07 | 173.5 | 99.6 | (102.1 predicted, -4.1) |
| 2002.08 | 183.6 | 116.4 | (98.5 predicted, -3.6) |
| 2002.09 | 175.8 | 109.6 | (95.5 predicted, -3.0) |
| 2002.10 | 167.0 | 97.5 | (92.0 predicted, -3.5) |
| 2002.11 | 168.7 | 95.0 | (86.7 predicted, -5.3) |
| 2002.12 | 157.2 | 81.6 | (82.4 predicted, -4.3) |
| 2003.01 | 149.3 (1) | 39.3 (2) | (79.4 predicted, -3.0) |
1) Running average based on the daily 20:00 UT observed solar flux value at 2800
MHz.
2) Unofficial, accumulated value based on the Boulder (SEC/NOAA) sunspot number. The official
international sunspot number is typically 25-45% less.
This report has been prepared by Jan Alvestad. It is based partly on my own observations and interpretations, and partly on data from sources noted in solar links. All time references are to the UTC day. Comments and suggestions are always welcome.
| [DX-Listeners' Club] |