
Last update issued on March 19, 2003 at 03:30 UTC. Minor update posted at 10:34 UTC.
[Solar and geomagnetic data
- last 4 weeks (updated daily)]
[Solar wind and electron
fluence charts (updated daily)]
[Solar cycles 21-23 (last
update March 3, 2003)]
[Solar cycles 1-20]
[Graphical comparison of
cycles 21, 22 and 23 (last update March 3, 2003)]
[Graphical comparison of
cycles 10, 13, 17, 20 and 23 (last update March 3, 2003)]
[Historical solar and geomagnetic
data charts 1954-2002 (last update January 27, 2003)]
[Archived reports (last update March 17, 2003)]
The geomagnetic field was unsettled to minor storm on March 18. Solar wind speed ranged between 627 and 834 km/sec under the influence of a high speed coronal hole stream.
Solar flux measured at 20h UTC on 2.8 GHz was 118.4. The planetary A
index was 26 (STAR Ap - based on the mean of three hour interval ap indices: 26.5).
Three hour interval K indices: 44454333 (planetary), 44344323 (Boulder).
The background x-ray flux is at the class B4 level.
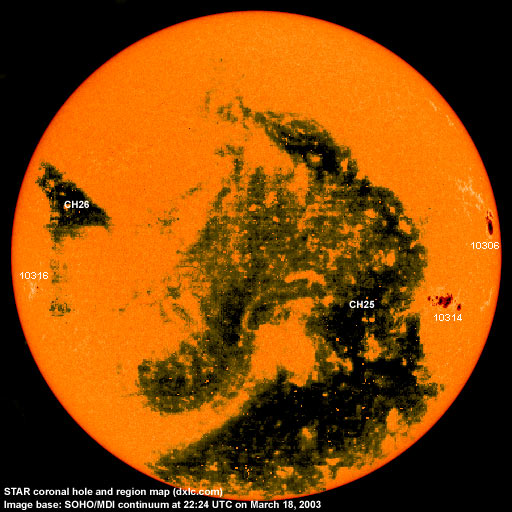
At midnight there were 3 spotted regions on the visible disk. Solar flare activity was high. A total of 10 C, 2 M and 1 X class events were recorded during the day.
Region 10306 decayed slowly and quietly. The region will soon begin rotating over the northwest limb.
Region 10314 decayed in the leading spot section while the main, central penumbra took on a more ragged appearance.
There is still a strong magnetic delta structure in this penumbra, however, the opposite polarity umbrae are not as close to each
other as they were one day ago. M class flares are likely. Flares: M1.6/1N at 00:37, C4.7/1F
at 01:53, M2.5/1B at 06:00, C2.1 at 06:45, C2.9 at 07:23, C2.4 at 10:23, X1.5/1B (with associated type II and IV radio sweeps) at
12:08, C2.8 at 16:20, C1.3 at 16:41, C5.9 at 19:03, C2.9 at 22:54, C5.1/2F at 23:28 and C5.3 at 00:02 (on March 19, the flare
began at 23:51 on March 18) UTC.
New region 10316 emerged near the southeast limb.
Comment added at 10:34 UTC on March 19: Region 10314 has produced 4 minor M class flares already today, the last an M3.7 event at 09:53 UTC. An M1.5 event was recorded at 03:07 UTC, while a long duration M1.2 event peaked near 03:40 UTC.
The CME associated with the X1 flare on March 18 was a full halo CME and is likely to impact Earth within the next 24 hours.
March 16: No obviously geoeffective CMEs observed.
March 17: A possibly geoeffective CME may have been associated with an X class flare in region 10314.
March 18: A fast CME, probably with a geoeffective extension, was observed after the X1/1B flare in region 10314. This CME could reach Earth late on March 19 or early on March 20 and add to the current diturbance.
Coronal hole history (since late October 2002)
Compare today's report with the situation one solar rotation ago: 28
days ago 27 days ago 26
days ago
A well defined, huge, recurrent coronal hole (CH25) mainly in the southern hemisphere will be in a geoeffective position on March 11-19. This coronal hole has developed in the northwestern and northeastern trans equatorial parts. After the emergence of region 10314 the central southeastern part of CH25 appears to have closed. A coronal hole (CH26) in the northern hemisphere will rotate into a geoeffective position on March 23.

Processed SOHO EIT 284 image at 01:06 UTC on March 19. Any black areas on the solar disk are likely coronal holes.
The geomagnetic field is expected to be mostly unsettled to active until March 23 due to a high speed stream. The current disturbance could intensify late on March 19 or early on March 20 if the CME associated with an X1 event in region 10314 near noon on March 18 arrives. Long distance medium wave (AM) band propagation along east-west paths over high and upper middle latitudes is poor, propagation along north-south paths is fair to good. [Trans Atlantic propagation conditions are currently monitored every night on 1470 kHz. Dominant stations tonight: Radio Cristal del Uruguay and Radio Vibraci�n.]
| Coronal holes (1) | Coronal mass ejections (2) | M and X class flares (3) |
1) Effects from a coronal hole could reach Earth within the
next 5 days.
2) Material from a CME is likely to impact Earth within 96 hours.
3) There is a possibility of either M or X class flares within the next 48
hours.
Green: 0-20% probability, Yellow: 20-60% probability, Red: 60-100% probability.
Compare to the previous day's image.
Data for all numbered solar regions according to the Solar Region Summary provided by SEC/NOAA. Comments are my own, as is the STAR spot count (spots observed at or inside a few hours before midnight) and data for regions not numbered by SEC or where SEC has observed no spots.
| Solar region | Date numbered | SEC spot count |
STAR spot count |
Location at midnight | Area | Classification | Comment |
|---|---|---|---|---|---|---|---|
| 10306 | 2003.03.07 | 3 | 7 | N07W72 | 0460 | DKO | beta-gamma |
| 10308 | 2003.03.08 | N11W59 | plage | ||||
| 10311 | 2003.03.09 | 2 | S12W76 | 0020 | HRX | now spotless | |
| 10313 | 2003.03.13 | N30W66 | plage | ||||
| 10314 | 2003.03.14 | 16 | 17 | S16W52 | 0500 | EKI | beta-gamma-delta |
| 10316 | 2003.03.18 | 3 | 3 | S12E66 | 0030 | CSO | |
| Total spot count: | 24 | 27 | |||||
| SSN: | 64 | 57 | |||||
| Month | Average solar flux at Earth |
International sunspot number | Smoothed sunspot number |
|---|---|---|---|
| 2000.04 | 184.2 | 125.5 | 120.8 cycle 23 sunspot max. |
| 2000.07 | 202.3 | 170.1 | 119.8 |
| 2001.12 | 235.1 | 132.2 | 114.6 (-0.9) |
| 2002.02 | 205.0 | 107.4 | 114.6 (+1.2) |
| 2002.03 | 179.5 | 98.4 | 113.3 (-1.3) |
| 2002.04 | 189.8 | 120.7 | 110.5 (-2.9) |
| 2002.05 | 178.4 | 120.8 | 108.8 (-1.7) |
| 2002.06 | 148.7 | 88.3 | 106.2 (-2.6) |
| 2002.07 | 173.5 | 99.6 | 102.7 (-3.5) |
| 2002.08 | 183.6 | 116.4 | 98.7 (-4.0) |
| 2002.09 | 175.8 | 109.6 | (94.7 predicted, -4.0) |
| 2002.10 | 167.0 | 97.5 | (91.2 predicted, -3.5) |
| 2002.11 | 168.7 | 95.0 | (86.0 predicted, -5.2) |
| 2002.12 | 157.2 | 81.6 | (81.6 predicted, -4.4) |
| 2003.01 | 144.0 | 79.5 | (78.6 predicted, -3.0) |
| 2003.02 | 124.5 | 46.2 | (73.6 predicted, -5.0) |
| 2003.03 | 139.7 (1) | 76.4 (2) | (67.9 predicted, -5.7) |
1) Running average based on the daily 20:00 UT observed solar flux value at 2800
MHz.
2) Unofficial, accumulated value based on the Boulder (SEC/NOAA) sunspot number. The official
international sunspot number is typically 25-45% less.
This report has been prepared by Jan Alvestad. It is based partly on my own observations and interpretations, and partly on data from sources noted in solar links. All time references are to the UTC day. Comments and suggestions are always welcome.
| [DX-Listeners' Club] |