
Last update issued on March 28, 2003 at 04:10 UTC.
[Solar and geomagnetic data - last 4 weeks (updated daily)]
[Solar wind and electron fluence charts (updated daily)]
[Solar cycles 21-23 (last update March 3, 2003)]
[Solar cycles 1-20]
[Graphical comparison of cycles 21, 22 and 23 (last update March 3, 2003)]
[Graphical comparison of cycles 10, 13, 17, 20 and 23 (last update March 3, 2003)]
[Historical solar and geomagnetic data charts 1954-2002 (last update January 27, 2003)]
[Archived reports (last update March 24, 2003)]
The geomagnetic field was quiet to minor storm on March 27. Solar wind speed ranged between 405 and 549 km/sec under the influence of a high speed stream.
Solar flux measured at 20h UTC on 2.8 GHz was 141.1. The planetary A
index was 27 (STAR Ap - based on the mean of three hour interval ap indices: 27.8).
Three hour interval K indices: 52544533 (planetary), 42543433 (Boulder).
The background x-ray flux is at the class B4 level.
At midnight there were 8 spotted regions on the visible disk, 1 of the regions has not yet been numbered by SEC/NOAA. Solar flare activity was low. A total of 7 C class events was recorded during the day. Region 10322 behind the northwest limb was the most active region during the day and produced a C2.2 flare at 02:01, a C3.6 flare at 09:45, a C2.3 flare at 14:55 and a C1.6 flare at 19:43 UTC.
Region 10318 developed slowly as several small spots emerged.
Region 10319 developed early on, then began to decay slowly as the positive and negative polarity areas drifted apart. Flares:
C1.2 at 04:16 and C1.2 at 05:40 UTC.
Region 10320 was quiet and stable.
Region 10321 decayed slowly but still has a small magnetic delta structure in the southernmost leading penumbra. While
the flare potential has decreased there is still a possibility of a minor M class flare. Flare:
C1.3 at 07:01 UTC.
Region 10323 decayed slowly and quietly.
New region 10324 rotated into view on March 26 and was numbered the next day. Slow development was observed during the day.
New region 10325 rotated into view at the northeast limb. So far only a single large penumbra has been observed.
Spotted regions not yet numbered by SEC/NOAA:
[S126] This region first emerged on March 24, then became spotless before reemerging with a single spot on March 27. Location at midnight:
S08W47.
March 25-27: No obviously geoeffective CMEs observed.
Coronal hole history (since late October 2002)
Compare today's report with the situation one solar rotation ago: 28
days ago 27 days ago 26
days ago
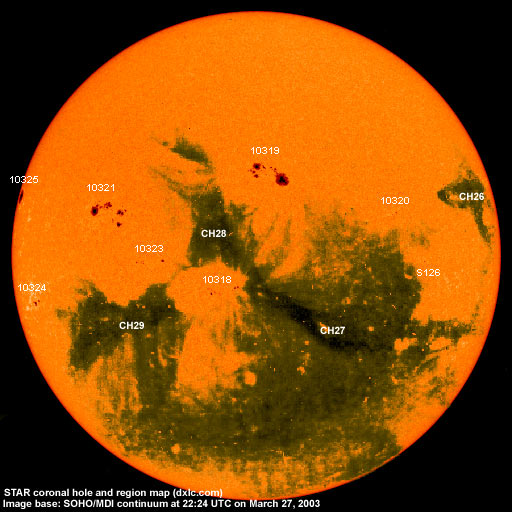
A coronal hole (CH27) in the southern hemisphere was in a geoeffective position on March 25-27, this coronal hole is best defined in the section due west of region 10318. A coronal hole (CH28) in the northern hemisphere will rotate into a geoeffective position on March 28. A coronal hole (CH29) in the southern hemisphere will be in a possibly geoeffective position on March 29-31.

Processed SOHO EIT 284 image at 19:06 UTC on March 27. Any black areas on the solar disk are likely coronal holes.
The geomagnetic field is expected to be quiet to minor storm on March 28 and quiet to active March 29-April 3 due to high speed streams from coronal holes CH27, CH28 and CH29. Long distance medium wave (AM) band propagation along east-west paths over high and upper middle latitudes is very poor, propagation along north-south paths is fair. [Trans Atlantic propagation conditions are currently monitored every night on 1470 kHz. Dominant station tonight: Radio Vibraci�n (Venezuela). WLAM (WMTW) Lewiston ME was noted at 05h UTC on March 27 during a brief opening towards the northeast USA]
| Coronal holes (1) | Coronal mass ejections (2) | M and X class flares (3) |
1) Effects from a coronal hole could reach Earth within the next 5 days.
2) Material from a CME is likely to impact Earth within 96 hours.
3) There is a possibility of either M or X class flares within the next 48 hours.
Green: 0-20% probability, Yellow: 20-60% probability, Red: 60-100% probability.
Compare to the previous day's image.
Data for all numbered solar regions according to the Solar Region Summary provided by SEC/NOAA. Comments are my own, as is the STAR spot count (spots observed at or inside a few hours before midnight) and data for regions not numbered by SEC or where SEC has observed no spots.
| Solar region | Date numbered | SEC spot count |
STAR spot count |
Location at midnight | Area | Classification | Comment |
|---|---|---|---|---|---|---|---|
| 10316 | 2003.03.18 | S11W54 | plage | ||||
| 10318 | 2003.03.22 | 7 | 9 | S15E09 | 0030 | DRO |
classification was DSO at midnight |
| 10319 | 2003.03.23 | 30 | 22 | N13W01 | 0340 | DKI | |
| 10320 | 2003.03.24 | 6 | 1 | N05W33 | 0020 | BXO |
classification was HRX at midnight, area 0010 |
| 10321 | 2003.03.24 | 29 | 25 | N05E34 | 0320 | EAC | beta-gamma-delta |
| 10323 | 2003.03.25 | 8 | 6 | S07E28 | 0040 | CSO | |
| 10324 | 2003.03.27 | 5 | 4 | S16E68 | 0080 | DAO |
formerly region S128 area was 0040 at midnight |
| 10325 | 2003.03.27 | 1 | 1 | N12E80 | 0200 | HHX |
classification was HSX at midnight |
| S126 | emerged on 2003.03.24 |
1 | S08W47 | 0000 | AXX | ||
| S127 | emerged on 2003.03.24 |
S17W50 | plage | ||||
| Total spot count: | 86 | 69 | |||||
| SSN: | 156 | 139 | |||||
| Month | Average solar flux at Earth |
International sunspot number | Smoothed sunspot number |
|---|---|---|---|
| 2000.04 | 184.2 | 125.5 | 120.8 cycle 23 sunspot max. |
| 2000.07 | 202.3 | 170.1 | 119.8 |
| 2001.12 | 235.1 | 132.2 | 114.6 (-0.9) |
| 2002.02 | 205.0 | 107.4 | 114.6 (+1.2) |
| 2002.03 | 179.5 | 98.4 | 113.3 (-1.3) |
| 2002.04 | 189.8 | 120.7 | 110.5 (-2.9) |
| 2002.05 | 178.4 | 120.8 | 108.8 (-1.7) |
| 2002.06 | 148.7 | 88.3 | 106.2 (-2.6) |
| 2002.07 | 173.5 | 99.6 | 102.7 (-3.5) |
| 2002.08 | 183.6 | 116.4 | 98.7 (-4.0) |
| 2002.09 | 175.8 | 109.6 | (94.7 predicted, -4.0) |
| 2002.10 | 167.0 | 97.5 | (91.2 predicted, -3.5) |
| 2002.11 | 168.7 | 95.0 | (86.0 predicted, -5.2) |
| 2002.12 | 157.2 | 81.6 | (81.6 predicted, -4.4) |
| 2003.01 | 144.0 | 79.5 | (78.6 predicted, -3.0) |
| 2003.02 | 124.5 | 46.2 | (73.6 predicted, -5.0) |
| 2003.03 | 128.4 (1) | 97.2 (2) | (67.9 predicted, -5.7) |
1) Running average based on the daily 20:00 UTC observed solar flux value at 2800 MHz.
2) Unofficial, accumulated value based on the Boulder (SEC/NOAA) sunspot number. The official international sunspot number is typically 25-45% less.
This report has been prepared by Jan Alvestad. It is based partly on my own observations and interpretations, and partly on data from sources noted in solar links. All time references are to the UTC day. Comments and suggestions are always welcome.
| [DX-Listeners' Club] |