
Last major update issued on November 28, 2003 at 04:20 UTC.
[Solar and geomagnetic data - last month (updated daily)]
[Solar wind and electron fluence charts (updated daily)]
[Solar cycles 21-23 (last update November 4, 2003)]
[Solar cycles 1-20]
[Graphical comparison of cycles 21, 22 and 23 (last update November 4, 2003)]
[Graphical comparison of cycles 2, 10, 13, 17, 20 and 23 (last update November
4, 2003)]
[Historical solar and geomagnetic data charts 1954-2003 (last update October 15, 2003)]
[Archived reports (last update November 22, 2003)]
The geomagnetic field was quiet to unsettled on November 27. Solar wind speed ranged between 400 and 527 km/sec, gradually decreasing all day.
Solar flux measured at 20h UTC on 2.8 GHz was 174.7. The planetary A
index was 10 (STAR Ap - based on the mean of three hour interval ap indices: 10.1).
Three hour interval K indices: 22223333 (planetary), 22122233 (Boulder).
The background x-ray flux is at the class B6 level.
At midnight there were 11 spotted regions on the visible disk. Solar flare activity was low. A total of 7 C class events were recorded during the day.
Region 10507 decayed further losing penumbral area and spots. An isolated M class flare is possible as there is still a magnetic delta structure in the
northern part of the largest penumbra.
Region 10508 decayed moderately quickly. Flares: C1.1 at 02:02, C1.9 at 06:46, C9.6
long duration event peaking at 08:20 (this event extended into region 10514 and was associated with a small and slow CME moving
off of the southwest limb) and C2.7 at 18:47 UTC.
Region 10509 developed slowly and was mostly quiet. Flare: C2.2 at 00:29 UTC.
Region 10510 developed in the leading spot section while decay was observed elsewhere. Flare:
C1.2 at 22:10 UTC.
Region 10511 decayed slowly and was quiet.
Region 10512 decayed and could soon become spotless. Flare: C3.2 at 12:26 UTC.
Region 10513 was quiet and stable.
New region 10514 emerged in the southwest quadrant on November 26 and was numbered the next day by SEC. The region appears
to be decaying and could soon become spotless.
Spotted regions not numbered by NOAA/SEC:
[S314] A new region emerged in the southeast quadrant on November 27 to the north of region 10510. Location at midnight:
S15E23.
[S315] This region rotated into view at the southeast limb late on November 27. Location at midnight: S16E80.
[S316] This region rotated into view at the southeast limb near the equator late on November 27. Location at midnight:
S03E79.
November 25-27: No partly or fully earth directed CMEs observed.
Coronal hole history (since late October 2002)
Compare today's report with the situation one solar rotation ago: 28
days ago 27 days ago
26 days ago
No obvious coronal holes are currently approaching geoeffective positions. The southernmost extensions of the northern polar coronal hole could be marginally geoeffective.

Processed SOHO/EIT 284 image at 01:05 UTC on November 28. The darkest areas on the solar disk are likely coronal holes.
The geomagnetic field is expected to be quiet to unsettled on November 28 - December 2.
Long distance low frequency (below 2 MHz) propagation along east-west paths over high and upper middle latitudes is very poor. Propagation along long distance north-south paths is poor. [Trans Atlantic propagation conditions are currently monitored every night on 1470 kHz. Dominant stations tonight: Radio Cristal del Uruguay and Cadena Peruana de Noticias].
| Coronal holes (1) | Coronal mass ejections (2) | M and X class flares (3) |
1) Effects from a coronal hole could reach Earth within the next 5 days. When the high speed stream has arrived
the color changes to green.
2) Material from a CME is likely to impact Earth within 96 hours.
3) There is a possibility of either M or X class flares within the next 48 hours.
Green: 0-20% probability, Yellow: 20-60% probability, Red: 60-100% probability.
Compare to the previous day's image.
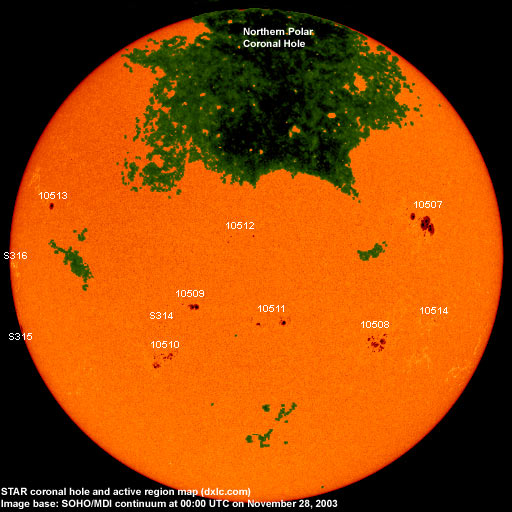
Data for all numbered solar regions according to the Solar Region Summary provided by NOAA/SEC. Comments are my own, as is the STAR spot count (spots observed at or inside a few hours before midnight) and data for regions not numbered by SEC or where SEC has observed no spots. SEC active region numbers in the table below and in the active region map above are the historic SEC/USAF numbers.
| Active region | Date numbered | SEC spot count |
STAR spot count |
Location at midnight | Area | Classification | Comment |
|---|---|---|---|---|---|---|---|
| 10505 | 2003.11.17 | S22W73 | plage | ||||
| 10506 | 2003.11.18 | 1 | S23W43 | 0000 | AXX | spotless | |
| 10507 | 2003.11.18 | 14 | 22 | N07W43 | 0540 | DKI |
beta-gamma-delta classification was DKC at midnight |
| 10508 | 2003.11.19 | 16 | 29 | S18W31 | 0180 | DAO |
classification was DAI at midnight |
| 10509 | 2003.11.24 | 6 | 8 | S11E15 | 0050 | DSO |
classification was CAO at midnight, area 0080 |
| 10510 | 2003.11.24 | 13 | 31 | S23E24 | 0080 | CSO |
classification was DAI at midnight |
| 10511 | 2003.11.25 | 6 | 17 | S15W02 | 0050 | DSO | |
| 10512 | 2003.11.25 | 6 | 7 | N06E04 | 0030 | CSO | |
| 10513 | 2003.11.26 | 1 | 1 | N13E58 | 0050 | HSX | |
| 10514 | 2003.11.27 | 1 | 2 | S16W46 | 0000 | AXX | formerly region S313 |
| S314 | emerged on 2003.11.27 |
2 | S15E23 | 0010 | BXO | ||
| S315 | visible on 2003.11.27 |
1 | S16E80 | 0040 | HSX | ||
| S316 | visible on 2003.11.27 |
1 | S03E79 | 0010 | AXX | ||
| Total spot count: | 64 | 121 | |||||
| SSN: | 154 | 231 | |||||
| Month | Average solar flux at Earth |
International sunspot number | Smoothed sunspot number |
|---|---|---|---|
| 2000.04 | 184.2 | 125.5 | 120.8 cycle 23 sunspot max. |
| 2000.07 | 202.3 | 170.1 | 119.8 |
| 2001.12 | 235.1 | 132.2 | 114.6 (-0.9) |
| 2002.10 | 167.0 | 97.5 | 90.5 (-4.1) |
| 2002.11 | 168.7 | 95.5 | 85.2 (-5.3) |
| 2002.12 | 157.2 | 80.8 | 82.0 (-3.2) |
| 2003.01 | 144.0 | 79.7 | 80.9 (-1.1) |
| 2003.02 | 124.5 | 46.0 | 78.5 (-2.4) |
| 2003.03 | 131.4 | 61.1 | 74.1 (-4.4) |
| 2003.04 | 126.4 | 60.0 | 70.3 (-3.8) |
| 2003.05 | 115.7 | 55.2 | (66.8 predicted, -3.5) |
| 2003.06 | 129.3 | 77.4 | (63.0 predicted, -3.8) |
| 2003.07 | 127.7 | 85.0 | (59.3 predicted, -3.7) |
| 2003.08 | 122.1 | 72.7 | (56.3 predicted, -3.0) |
| 2003.09 | 112.2 | 48.8 | (54.3 predicted, -2.0) |
| 2003.10 | 151.7 | 65.6 | (51.6 predicted, -2.7) |
| 2003.11 | 138.4 (1) | 85.0 (2) | (48.9 predicted, -2.7) |
1) Running average based on the daily 20:00 UTC observed solar flux value at 2800 MHz.
2) Unofficial, accumulated value based on the Boulder (NOAA/SEC) sunspot number. The official international sunspot number is typically
30-50% less.
This report has been prepared by Jan Alvestad. It is based partly on my own observations and analysis, and partly on data from sources noted in solar links. All time references are to the UTC day. Comments and suggestions are always welcome.
| [DX-Listeners' Club] |