
Last update issued on September 30, 2003 at 04:00 UTC.
[Solar and geomagnetic data - last month (updated daily)]
[Solar wind and electron fluence charts (updated daily)]
[Solar cycles 21-23 (last update September 1, 2003)]
[Solar cycles 1-20]
[Graphical comparison of cycles 21, 22 and 23 (last update September 1, 2003)]
[Graphical comparison of cycles 2, 10, 13, 17, 20 and 23 (last update September
1, 2003)]
[Historical solar and geomagnetic data charts 1954-2003 (last update July 23, 2003)]
[Archived reports (last update September 29, 2003)]
The geomagnetic field was very quiet to unsettled on September 29. Solar wind speed ranged between 275 and 375 km/sec. A fairly weak high speed stream from coronal hole CH60 was likely causing an increase in solar wind speed beginning at ACE at 01h UTC on September 30.
Solar flux measured at 20h UTC on 2.8 GHz was 135.1. The planetary A
index was 7 (STAR Ap - based on the mean of three hour interval ap indices: 7.4).
Three hour interval K indices: 22133221 (planetary), 22121112 (Boulder).
The background x-ray flux is at the class B6 level.
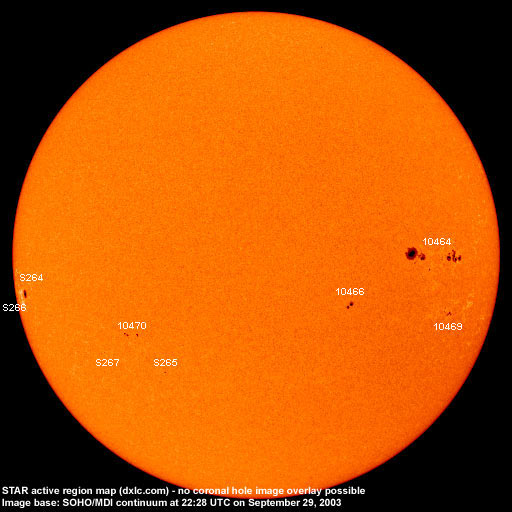
At midnight there were 8 spotted regions on the visible disk. Solar flare activity was low. A total of 10 C class events was recorded during the day. Optically uncorrelated flares: C1.8 at 03:59, C3.9 at 05:11, C3.3 at 13:39, C2.2 at 14:07, C1.5 at 16:40, C1.6 at 18:04 and C1.7 at 21:11 UTC.
Region 10464 decayed quickly losing nearly all intermediate spots as well as several spots and quite a bit of penumbral
area in both the leading and trailing spot sections. Flares: C5.1 at 16:10, C3.8 at 20:04 and
C5.4/1F at 21:46 UTC.
Region 10466 decayed with the main penumbra splitting into two smaller penumbrae. All small spots disappeared.
Region 10469 decayed further during the first half of the day, then began to develop as new flux emerged in the leading
negative polarity area.
New region 10470 emerged on September 28 and was numbered by SEC the next day. The region developed slowly on September 29.
Spotted regions not numbered by NOAA/SEC:
[S264] This region was partially visible late on September 28 at the southeast limb and rotated fully into view with a
single asymmetrical penumbra. Location at midnight: S07E72.
[S265] A new region emerged in the southeast quadrant on September 29. Location at midnight: S23E24.
[S266] A region trailing region S264 rotated into view late on September 29. Location at midnight: S09E82.
[S267] This region emerged in the southeast quadrant on September 29. Location at midnight: S18E41.
September 27 and 29: No potentially geoeffective CMEs observed.
September 28: CMEs were observed mainly off the north and south poles. A fainter extension over the east limb indicates that one of the CMEs may have been a partial halo CME. With no EIT images available it is difficult to determine if the CMEs had frontside or backside sources.
Coronal hole history (since late October 2002)
Compare today's report with the situation one solar rotation ago: 28
days ago 27 days ago 26 days ago
A coronal hole (CH60) in the northern hemisphere was in a geoeffective position on September 26-28.

Processed SOHO/EIT 284 image at 19:06 UTC on September 25. The darkest areas on the solar disk are likely coronal holes.
The geomagnetic field is expected to be quiet to active until October 2 due to a high speed stream from coronal hole CH60.
Long distance low frequency (below 2 MHz) propagation along east-west paths over high and upper middle latitudes is poor. Propagation along north-south paths is fair. [Trans Atlantic propagation conditions are currently monitored every night on 1470 kHz. Dominant stations tonight: Radio Cristal del Uruguay early on, then Radio Vibraci�n (Venezuela)].
| Coronal holes (1) | Coronal mass ejections (2) | M and X class flares (3) |
1) Effects from a coronal hole could reach Earth within the next 5 days.
2) Material from a CME is likely to impact Earth within 96 hours.
3) There is a possibility of either M or X class flares within the next 48 hours.
Green: 0-20% probability, Yellow: 20-60% probability, Red: 60-100% probability.
Compare to the previous day's image.
Data for all numbered solar regions according to the Solar Region Summary provided by NOAA/SEC. Comments are my own, as is the STAR spot count (spots observed at or inside a few hours before midnight) and data for regions not numbered by SEC or where SEC has observed no spots.
| Solar region | Date numbered | SEC spot count |
STAR spot count |
Location at midnight | Area | Classification | Comment |
|---|---|---|---|---|---|---|---|
| 10464 | 2003.09.20 | 43 | 34 | N03W48 | 0530 | FKC |
beta-gamma classification was FKO at midnight |
| 10465 | 2003.09.22 | S02W45 | plage | ||||
| 10466 | 2003.09.22 | 5 | 2 | S05W23 | 0050 | DSO |
classification was HSX at midnight, only negative polarity spots |
| 10467 | 2003.09.23 | 1 | S11W32 | 0010 | HSX | spotless | |
| 10469 | 2003.09.27 | 3 | 7 | S10W52 | 0030 | HSX |
classification was CAO at midnight |
| 10470 | 2003.09.29 | 6 | 7 | S13E32 | 0030 | DSO |
formerly region S263 classification was DAO at midnight |
| S261 | emerged on 2003.09.23 |
S08W62 | plage | ||||
| S264 | visible on 2003.09.28 |
1 | S07E72 | 0110 | HAX | ||
| S265 | emerged on 2003.09.29 |
2 | S23E24 | 0010 | HRX | ||
| S266 | visible on 2003.09.29 |
1 | S09E82 | 0020 | HSX | ||
| S267 | emerged on 2003.09.29 |
1 | S18E41 | 0000 | AXX | ||
| Total spot count: | 58 | 55 | |||||
| SSN: | 108 | 135 | |||||
| Month | Average solar flux at Earth |
International sunspot number | Smoothed sunspot number |
|---|---|---|---|
| 2000.04 | 184.2 | 125.5 | 120.8 cycle 23 sunspot max. |
| 2000.07 | 202.3 | 170.1 | 119.8 |
| 2001.12 | 235.1 | 132.2 | 114.6 (-0.9) |
| 2002.08 | 183.6 | 116.4 | 98.7 (-4.0) |
| 2002.09 | 175.8 | 109.6 | 94.6 (-4.1) |
| 2002.10 | 167.0 | 97.5 | 90.5 (-4.1) |
| 2002.11 | 168.7 | 95.5 | 85.2 (-5.3) |
| 2002.12 | 157.2 | 80.8 | 82.0 (-3.2) |
| 2003.01 | 144.0 | 79.7 | 81.0 (-1.0) |
| 2003.02 | 124.5 | 46.0 | 78.5 (-2.5) |
| 2003.03 | 131.4 | 61.1 | (74.2 predicted, -4.3) |
| 2003.04 | 126.4 | 60.0 | (69.3 predicted, -4.9) |
| 2003.05 | 115.7 | 55.2 | (64.4 predicted, -4.9) |
| 2003.06 | 129.3 | 77.4 | (60.4 predicted, -4.0) |
| 2003.07 | 127.7 | 85.0 | (56.9 predicted, -3.5) |
| 2003.08 | 122.1 | 72.7 | (53.9 predicted, -3.0) |
| 2003.09 | 111.5 (1) | 78.1 (2) | (51.9 predicted, -2.0) |
1) Running average based on the daily 20:00 UTC observed solar flux value at 2800 MHz.
2) Unofficial, accumulated value based on the Boulder (NOAA/SEC) sunspot number. The official international sunspot number is typically
30-50% less.
This report has been prepared by Jan Alvestad. It is based partly on my own observations and analysis, and partly on data from sources noted in solar links. All time references are to the UTC day. Comments and suggestions are always welcome.
| [DX-Listeners' Club] |