
Last major update issued on August 4, 2004 at 04:45 UTC.
[Solar and geomagnetic data - last month (updated daily)]
[Solar wind and electron fluence charts (updated daily)]
[Solar cycles 21-23 (last update August 2, 2004)]
[Solar cycles 1-20]
[Graphical comparison of cycles 21, 22 and 23 (last update August 2, 2004)]
[Graphical comparison of cycles 2, 10, 13, 17, 20 and 23 (last update August 2, 2004)]
[Historical solar and geomagnetic data charts 1954-2004 (last update April 28,
2004)]
[Archived reports (last update August 1, 2004)]
The geomagnetic field was quiet on August 3. Solar wind speed ranged between 345 and 418 km/sec.
Solar flux measured at 20h UTC on 2.8 GHz was 87.6. The planetary A
index was 5 (STAR Ap - based on the mean of three hour interval ap indices: 6.3).
Three hour interval K indices: 22112212 (planetary), 23101002 (Boulder).
The background x-ray flux is at the class A8 level.
At midnight there were 3 spotted regions on the visible disk. The solar flare activity level was very low. No C class events were recorded during the day.
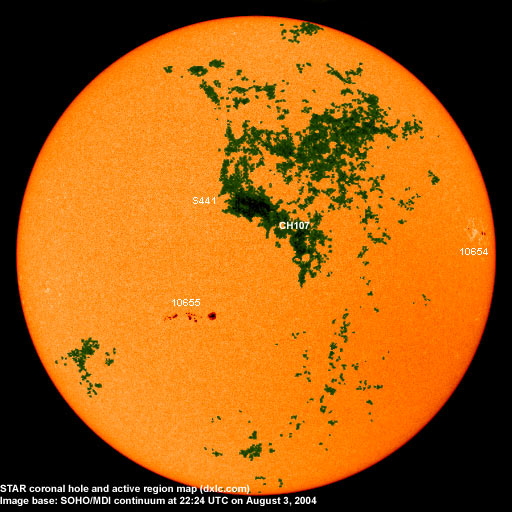
Region 10654 decayed slowly and will rotate over the northwest limb late today and early tomorrow.
Region 10655 developed slowly with several new, small spots emerging in the trailing and intermediate spot section. In the
center of the region there is very little separating the positive and negative polarity areas and a magnetic delta structure could
easily form. C flares are possible and a minor M class flare will become possible if development continues.
Spotted regions not numbered by NOAA/SEC:
[S441] This region finally developed spots in the positive polarity area on August 3. Location at midnight: N16E13.
August 1-3: No obviously Earth directed CMEs detected in LASCO images.
Coronal hole history (since late October 2002)
Compare today's report with the situation one solar rotation ago: 28
days ago 27 days ago 26 days ago
A small coronal hole (CH107) in the northern hemisphere was in a geoeffective position on August 3.

Processed SOHO/EIT 284 image at 19:06 UTC on August 3. The darkest areas on the solar disk are likely coronal holes.
The geomagnetic field is expected to be quiet to unsettled on August 4-5 with unsettled to active conditions on August 6-7 due to a high speed stream from coronal hole CH107.
| Coronal holes (1) | Coronal mass ejections (2) | M and X class flares (3) |
1) Effects from a coronal hole could reach Earth within the next 5 days. When the high speed stream has arrived
the color changes to green.
2) Material from a CME is likely to impact Earth within 96 hours.
3) There is a possibility of either M or X class flares within the next 48 hours.
Green: 0-20% probability, Yellow: 20-60% probability, Red: 60-100% probability.
Long distance low and medium frequency (below 2 MHz) propagation along east-west paths over high and upper middle latitudes is poor and improving. Propagation along long distance north-south paths is good. Trans Atlantic propagation conditions are monitored every night on 1470 kHz. Dominant stations tonight: Radio Cristal del Uruguay (the station was noted as early as 22:22 UTC) with several unidentified stations from Brazil noted after 22h UTC. Post sunrise propagation was best towards Argentina and Uruguay. A few stations from the USA were heard (1650, 1660 and 1700 kHz) and signals from the eastern Caribbean were better than they have been since late spring.
Compare to the previous day's image.
Data for all numbered solar regions according to the Solar Region Summary provided by NOAA/SEC. Comments are my own, as is the STAR spot count (spots observed at or inside a few hours before midnight) and data for regions not numbered by SEC or where SEC has observed no spots. SEC active region numbers in the table below and in the active region map above are the historic SEC/USAF numbers.
| Active region | Date numbered | SEC spot count |
STAR spot count |
Location at midnight | Area | Classification | Comment |
|---|---|---|---|---|---|---|---|
| 10654 | 2004.07.25 | 5 | 4 | N07W71 | 0060 | DAO |
classification was CSO, area 0040 at midnight |
| 10655 | 2004.07.30 | 27 | 40 | S09E16 | 0200 | EAC |
beta-gamma classification was EAI, area 0150 at midnight |
| S441 | emerged on 2004.08.03 |
3 | N16E13 | 0000 | AXX | ||
| Total spot count: | 32 | 47 | |||||
| SSN: | 52 | 77 | |||||
| Month | Average solar flux at Earth |
International sunspot number | Smoothed sunspot number |
|---|---|---|---|
| 2000.04 | 184.2 | 125.5 | 120.8 cycle 23 sunspot max. |
| 2000.07 | 202.3 | 170.1 | 119.8 |
| 2001.12 | 235.1 | 132.2 | 114.6 (-0.9) |
| 2003.06 | 129.3 | 77.4 | 65.0 (-2.6) |
| 2003.07 | 127.7 | 83.3 | 61.8 (-3.2) |
| 2003.08 | 122.1 | 72.7 | 60.1 (-1.7) |
| 2003.09 | 112.2 | 48.7 | 59.6 (-0.5) |
| 2003.10 | 151.7 | 65.5 | 58.2 (-1.4) |
| 2003.11 | 140.8 | 67.3 | 56.8 (-1.4) |
| 2003.12 | 114.9 | 46.5 | 54.8 (-2.0) |
| 2004.01 | 114.1 | 37.7 | 52.0 (-2.8) |
| 2004.02 | 107.0 | 45.8 | (49.1 predicted, -2.9) |
| 2004.03 | 112.0 | 49.1 | (46.5 predicted, -2.6) |
| 2004.04 | 101.2 | 39.3 | (44.3 predicted, -2.2) |
| 2004.05 | 99.8 | 41.5 | (41.0 predicted, -3.3) |
| 2004.06 | 97.4 | 43.2 | (38.2 predicted, -2.8) |
| 2004.07 | 119.1 | 51.0 | (36.3 predicted, -1.9) |
| 2004.08 | 85.2 (1) | 4.2 (2) | (34.9 predicted, -1.4) |
1) Running average based on the daily 20:00 UTC observed solar flux value at 2800 MHz.
2) Unofficial, accumulated value based on the Boulder (NOAA/SEC) sunspot number. The official international sunspot number is typically
30-50% less.
This report has been prepared by Jan Alvestad. It is based partly on my own observations and analysis, and partly on data from some of these solar data sources. All time references are to the UTC day. Comments and suggestions are always welcome.
| [DX-Listeners' Club] |