
Last major update issued on August 14, 2004 at 05:00 UTC.
[Solar and geomagnetic data - last month (updated daily)]
[Solar wind and electron fluence charts (updated daily)]
[Solar cycles 21-23 (last update August 2, 2004)]
[Solar cycles 1-20]
[Graphical comparison of cycles 21, 22 and 23 (last update August 2, 2004)]
[Graphical comparison of cycles 2, 10, 13, 17, 20 and 23 (last update August 2, 2004)]
[Historical solar and geomagnetic data charts 1954-2004 (last update April 28,
2004)]
[Archived reports (last update August 10, 2004)]
The geomagnetic field was quiet to unsettled on August 13. Solar wind speed ranged between 363 and 495 km/sec.
Solar flux measured at 20h UTC on 2.8 GHz was 148.6 (influenced by a C4 flare at the time, values at 17 or 23h UTC near 140
should probably be used instead). The planetary A
index was 9 (STAR Ap - based on the mean of three hour interval ap indices: 9.4).
Three hour interval K indices: 22213233 (planetary), 22122323 (Boulder).
The background x-ray flux is at the class C1 level.
At midnight there were 4 spotted regions on the visible disk. The solar flare activity level was high. A total of 13 C, 5 M and 1 X class events was recorded during the day.
Region 10656 gained some penumbra on the leader spots and in the southeastern part. Quite a few small spots disappeared
and decay was observed in the central part of the region. The positive magnetic area to the southwest of the central penumbra
became better organized and extended into the negative polarity area in the north and east. Further major flares are possible. Flares:
C2.2 at 01:02, C1.9 at 02:55, C4.6 at 06:47, M1.2 at 07:29, C2.4 at 09:43, M1.1/1F at 12:09, C8.6/1F at 15:16, C2.3 at 16:58, very
impulsive X1.0/1N at 18:12, impulsive M6 at 18:18 (unreported by SEC, the center of this flare was slightly to the northwest of
the X1 event and probably triggered by that event), C4.0 at 20:00, C3.5 at 23:07, long duration C8.6 peaking at 23:18, M3.0 at
23:43 and M2.8 at 23:50 UTC.
Region 10657 decayed slowly and quietly.
Region 10660 decayed with the trailing spot becoming very small.
Region 10661 rotated fully into view at the northeast limb. Both spots have positive polarity. Bright plage is observed in
the northeast over the spotless negative polarity area.
August 11-12: No obviously Earth directed CMEs were detected in LASCO images.
August 13: While there were no significant CMEs associated with the M and X class flares in region 10656, difference movies
indicate small CMEs over the south pole and the southwest limb.
Coronal hole history (since late October 2002)
Compare today's report with the situation one solar rotation ago: 28
days ago 27 days ago 26 days ago
No obvious coronal holes are currently approaching geoeffective positions.

Processed SOHO/EIT 284 image at 01:06 UTC on August 14. The darkest areas on the solar disk are likely coronal holes.
The geomagnetic field is expected to be quiet to unsettled on August 14-16.
| Coronal holes (1) | Coronal mass ejections (2) | M and X class flares (3) |
1) Effects from a coronal hole could reach Earth within the next 5 days. When the high speed stream has arrived
the color changes to green.
2) Material from a CME is likely to impact Earth within 96 hours.
3) There is a possibility of either M or X class flares within the next 48 hours.
Green: 0-20% probability, Yellow: 20-60% probability, Red: 60-100% probability.
Long distance low and medium frequency (below 2 MHz) propagation along east-west paths over high and upper middle latitudes is poor to fair. Propagation along long distance north-south paths is fair. Trans Atlantic propagation conditions are monitored every night on 1470 kHz. Dominant stations tonight: none, Radio Cristal del Uruguay, Radio Vibraci�n (Venezuela), Radio Rafaela (Argentina) and R�dio Papacasa (Brazil) were all noted at different times. A brief and intense opening was noted towards Uruguay at local sunrise with Radio Internacional (Uruguay) best on 1480 kHz. Several stations from North America were heard after midnight UTC, 1510 WWZN and 1650 Radio Disney had the best signals.
Compare to the previous day's image.
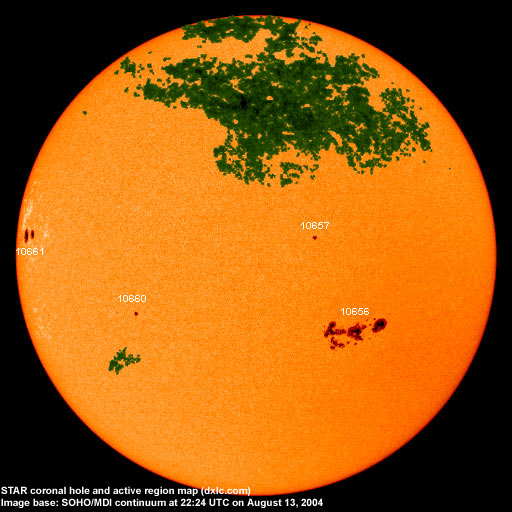
Data for all numbered solar regions according to the Solar Region Summary provided by NOAA/SEC. Comments are my own, as is the STAR spot count (spots observed at or inside a few hours before midnight) and data for regions not numbered by SEC or where SEC has observed no spots. SEC active region numbers in the table below and in the active region map above are the historic SEC/USAF numbers.
| Active region | Date numbered | SEC spot count |
STAR spot count |
Location at midnight | Area | Classification | Comment |
|---|---|---|---|---|---|---|---|
| 10656 | 2004.08.06 | 99 | 72 | S13W22 | 1360 | FKC | beta-gamma-delta |
| 10657 | 2004.08.06 | 1 | 1 | N10W15 | 0030 | HSX | |
| 10658 | 2004.08.07 | S05W27 | plage | ||||
| 10659 | 2004.08.10 | 6 | N18E20 | 0010 | BXO | spotless | |
| 10660 | 2004.08.11 | 2 | 2 | S07E35 | 0040 | CAO |
classification was CSO at midnight |
| 10661 | 2004.08.12 | 2 | 2 | N07E73 | 0360 | DAO | |
| S444 | emerged on 2004.08.09 |
S10E07 | plage | ||||
| Total spot count: | 110 | 77 | |||||
| SSN: | 160 | 117 | |||||
| Month | Average solar flux at Earth |
International sunspot number | Smoothed sunspot number |
|---|---|---|---|
| 2000.04 | 184.2 | 125.5 | 120.8 cycle 23 sunspot max. |
| 2000.07 | 202.3 | 170.1 | 119.8 |
| 2001.12 | 235.1 | 132.2 | 114.6 (-0.9) |
| 2003.06 | 129.3 | 77.4 | 65.0 (-2.6) |
| 2003.07 | 127.7 | 83.3 | 61.8 (-3.2) |
| 2003.08 | 122.1 | 72.7 | 60.1 (-1.7) |
| 2003.09 | 112.2 | 48.7 | 59.6 (-0.5) |
| 2003.10 | 151.7 | 65.5 | 58.2 (-1.4) |
| 2003.11 | 140.8 | 67.3 | 56.8 (-1.4) |
| 2003.12 | 114.9 | 46.5 | 54.8 (-2.0) |
| 2004.01 | 114.1 | 37.7 | 52.0 (-2.8) |
| 2004.02 | 107.0 | 45.8 | (49.1 predicted, -2.9) |
| 2004.03 | 112.0 | 49.1 | (46.5 predicted, -2.6) |
| 2004.04 | 101.2 | 39.3 | (44.3 predicted, -2.2) |
| 2004.05 | 99.8 | 41.5 | (41.0 predicted, -3.3) |
| 2004.06 | 97.4 | 43.2 | (38.2 predicted, -2.8) |
| 2004.07 | 119.1 | 51.0 | (36.3 predicted, -1.9) |
| 2004.08 | 106.2 (1) | 33.5 (2) | (34.9 predicted, -1.4) |
1) Running average based on the daily 20:00 UTC observed solar flux value at 2800 MHz.
2) Unofficial, accumulated value based on the Boulder (NOAA/SEC) sunspot number. The official international sunspot number is typically
30-50% less.
This report has been prepared by Jan Alvestad. It is based partly on my own observations and analysis, and partly on data from some of these solar data sources. All time references are to the UTC day. Comments and suggestions are always welcome.
| [DX-Listeners' Club] |