
Last major update issued on December 3, 2004 at 04:20 UTC.
[Solar and geomagnetic data - last month (updated daily)]
[Solar wind and electron fluence charts (updated daily)]
[Solar cycles 21-23 (last update December 3, 2004)]
[Solar cycles 1-20]
[Graphical comparison of cycles 21, 22 and 23 (last update December 3, 2004)]
[Graphical comparison of cycles 2, 10, 13, 17, 20 and 23 (last update December
3, 2004)]
[Historical solar and geomagnetic data charts 1954-2004 (last update November 8,
2004)]
[Archived reports (last update December 1, 2004)]
The geomagnetic field was inactive to quiet on December 2. Solar wind speed ranged between 438 and 564 km/sec, gradually decreasing all day.
Solar flux measured at 20h UTC on 2.8 GHz was 105.6. The planetary A
index was 4 (STAR Ap - based on the mean of three hour interval ap indices: 4.1).
Three hour interval K indices: 11201211 (planetary), 11201221 (Boulder).
The background x-ray flux is at the class B2 level.
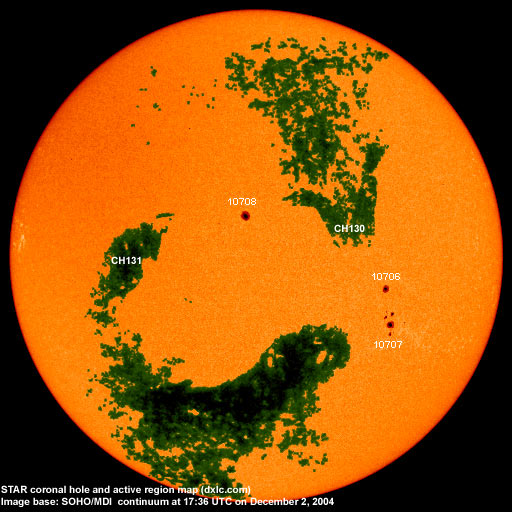
At midnight there were 3 spotted regions on the visible solar disk. The solar flare activity level was moderate. A total of 1 M class event was recorded during the day.
Region 10706 decayed slowly and quietly.
December 3: A full halo CME was observed in LASCO C3 images beginning at 00:42 UTC. This CME was fairly fast and aimed
squarely at Earth. An impact is likely sometime between the evening of December 4 and noon on December 5.
December 1: A full halo CME was observed after an M1 event in region 10708 during the morning. The CME was best defined
over the northeast limb, however, faint material movement was observed in all other directions in LASCO C3 images. Another and
slower CME with a source well behind the northwest limb was observed at the same time.
November 30 and December 2: No obviously Earth directed CMEs observed.
Coronal hole history (since late October 2002)
Compare today's report with the situation one solar rotation ago: 28
days ago 27 days ago 26 days ago
Recurrent coronal hole CH130 in the northern hemisphere was in a geoeffective position on November 30 and December 1. Recurrent trans equatorial coronal hole CH131 will likely rotate into a geoeffective position on December 5.

Processed SOHO/EIT 284 image at 01:06 UTC on December 3. The darkest areas on the solar disk are likely coronal holes.
The geomagnetic field is expected to be quiet to unsettled on December 3-4 with a possibility of isolated active intervals due to effects from coronal hole CH130. Late on December 4 or early on December 5 a solar wind shock is expected from the CME observed early on December 3. Active to major storm conditions are possible for 12-18 hours after the arrival of the shock. On December 5-6 quiet to unsettled conditions are likely.
| Coronal holes (1) | Coronal mass ejections (2) | M and X class flares (3) |
1) Effects from a coronal hole could reach Earth within the next 5 days. When the high speed stream has arrived
the color changes to green.
2) Material from a CME is likely to impact Earth within 96 hours.
3) There is a possibility of either M or X class flares within the next 48 hours.
Green: 0-20% probability, Yellow: 20-60% probability, Red: 60-100% probability.
Long distance low and medium frequency (below 2 MHz) propagation along east-west paths over high and upper middle latitudes is poor. Propagation along long distance north-south paths is poor to fair. Trans Atlantic propagation conditions are normally monitored every night on 1470 kHz. Dominant stations tonight: Radio Cristal del Uruguay and Radio Vibraci�n (Venezuela). On other frequencies mostly stations from North America could be heard with the best signals from VOCM on 590, Greenland on 650 and WWZN on 1510 kHz. Most signals were weak.
Compare to the previous day's image.
Data for all numbered solar regions according to the Solar Region Summary provided by NOAA/SEC. Comments are my own, as is the STAR spot count (spots observed at or inside a few hours before midnight) and data for regions not numbered by SEC or where SEC has observed no spots. SEC active region numbers in the table below and in the active region map above are the historic SEC/USAF numbers.
| Active region | Date numbered | SEC spot count |
STAR spot count |
Location at midnight | Area | Classification | Comment |
|---|---|---|---|---|---|---|---|
| 10706 | 2004.11.24 | 3 | 1 | S05W26 | 0090 | CSO |
classification was HSX at midnight, area 0060 |
| 10707 | 2004.11.24 | 19 | 11 | S14W37 | 0230 | DAC |
beta-gamma classification was DAO at midnight, area 0110 |
| 10708 | 2004.11.26 | 10 | 5 | N09E01 | 0150 | DSI |
classification was CSO at midnight, area 0120 DSI classification is invalid, no trailing spots had penumbra at any time during the day |
| Total spot count: | 32 | 17 | |||||
| SSN: | 62 | 47 | |||||
| Month | Average solar flux at Earth |
International sunspot number | Smoothed sunspot number |
|---|---|---|---|
| 2000.04 | 184.2 | 125.5 | 120.8 cycle 23 sunspot max. |
| 2000.07 | 202.3 | 170.1 | 119.8 |
| 2001.12 | 235.1 | 132.2 | 114.6 (-0.9) |
| 2003.10 | 151.7 | 65.5 | 58.2 (-1.3) |
| 2003.11 | 140.8 | 67.3 | 56.7 (-1.5) |
| 2003.12 | 114.9 | 46.5 | 54.8 (-1.9) |
| 2004.01 | 114.1 | 37.3 | 52.0 (-2.8) |
| 2004.02 | 107.0 | 45.8 | 49.3 (-2.7) |
| 2004.03 | 112.0 | 49.1 | 47.1 (-2.2) |
| 2004.04 | 101.2 | 39.3 | 45.5 (-1.6) |
| 2004.05 | 99.8 | 41.5 | 43.9 (-1.6) |
| 2004.06 | 97.4 | 43.2 | (42.2 predicted, -1.7) |
| 2004.07 | 119.1 | 51.0 | (40.6 predicted, -1.6) |
| 2004.08 | 109.6 | 40.9 | (39.0 predicted, -1.6) |
| 2004.09 | 103.1 | 27.7 | (37.1 predicted, -1.9) |
| 2004.10 | 105.9 | 48.4 | (34.9 predicted, -2.2) |
| 2004.11 | 113.2 | 43.7 | (33.0 predicted, -1.9) |
| 2004.12 | 108.3 (1) | 3.7 (2) | (30.7 predicted, -2.3) |
1) Running average based on the daily 20:00 UTC observed solar flux value at 2800 MHz.
2) Unofficial, accumulated value based on the Boulder (NOAA/SEC) sunspot number. The official international sunspot number is typically
30-50% less.
This report has been prepared by Jan Alvestad. It is based partly on my own observations and analysis, and partly on data from some of these solar data sources. All time references are to the UTC day. Comments and suggestions are always welcome.
| [DX-Listeners' Club] |