
Last major update issued on May 10, 2004 at 03:30 UTC.
[Solar and geomagnetic data - last month (updated daily)]
[Solar wind and electron fluence charts (updated daily)]
[Solar cycles 21-23 (last update May 3, 2004)]
[Solar cycles 1-20]
[Graphical comparison of cycles 21, 22 and 23 (last update May 3, 2004)]
[Graphical comparison of cycles 2, 10, 13, 17, 20 and 23 (last update May 3, 2004)]
[Historical solar and geomagnetic data charts 1954-2004 (last update April 28,
2004)]
[Archived reports (last update May 8, 2004)]
The geomagnetic field was quiet to unsettled on May 9. Solar wind speed ranged between 392 and 466 km/sec, slowly decreasing.
Solar flux measured at 20h UTC on 2.8 GHz was 93.2. The planetary A
index was 6 (STAR Ap - based on the mean of three hour interval ap indices: 7.8).
Three hour interval K indices: 23212221 (planetary), 23223212 (Boulder).
The background x-ray flux is at the class A8 level.
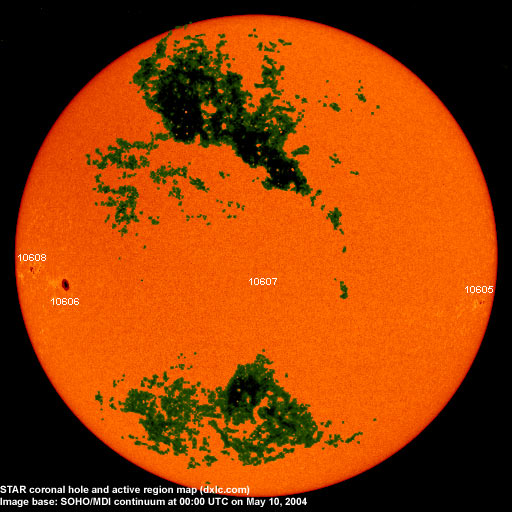
At midnight there were 4 spotted regions on the visible disk. The solar flare activity level was very low. No C class events were recorded during the day.
Region 10605 decayed slowly and quietly and will rotate out of view at the southwest limb late today.
Region 10606 was quiet and stable.
New region 10607 emerged in the southeast quadrant on May 7 and was numbered by SEC two days later. The region could soon
become spotless.
New region 10608 emerged quickly on May 9 near the southeast limb. A C flare is possible.
May 8-9: No fully or partly Earth directed CME observed.
May 7: A faint halo CME was observed in LASCO images after 15h UTC. This CME may have been associated with a C1 event in
region 10605.
Coronal hole history (since late October 2002)
Compare today's report with the situation one solar rotation ago: 28
days ago 27 days ago 26 days ago
A coronal hole in the northern hemisphere is probably located too far to the north to become geoeffective.

Processed SOHO/EIT 284 image at 19:05 UTC on May 9. The darkest areas on the solar disk are likely coronal holes.
The geomagnetic field is expected to be mostly quiet on May 10-12. A weak CME could arrive during the latter half of May 10 and cause a slight increase in geomagnetic activity.
| Coronal holes (1) | Coronal mass ejections (2) | M and X class flares (3) |
1) Effects from a coronal hole could reach Earth within the next 5 days. When the high speed stream has arrived
the color changes to green.
2) Material from a CME is likely to impact Earth within 96 hours.
3) There is a possibility of either M or X class flares within the next 48 hours.
Green: 0-20% probability, Yellow: 20-60% probability, Red: 60-100% probability.
Long distance low and medium frequency (below 2 MHz) propagation along east-west paths over high and upper middle latitudes is poor. Propagation along long distance north-south paths is fair. Trans Atlantic propagation conditions are monitored every night on 1470 kHz. Dominant station tonight: Radio Vibraci�n (strong signal). At local sunrise CPN Radio (Per�) was heard at the same level as Vibraci�n. Propagation swung somewhat southwards after 02:30 UTC with Argentina noted on 1630 and R�dio Nacional in Brasilia doing well on 980 kHz. Before that I heard several stations from North America, including most of the usual Newfoundland stations and US stations on 1440, 1510, 1540, 1650 and 1660 kHz].
Compare to the previous day's image.
Data for all numbered solar regions according to the Solar Region Summary provided by NOAA/SEC. Comments are my own, as is the STAR spot count (spots observed at or inside a few hours before midnight) and data for regions not numbered by SEC or where SEC has observed no spots. SEC active region numbers in the table below and in the active region map above are the historic SEC/USAF numbers.
| Active region | Date numbered | SEC spot count |
STAR spot count |
Location at midnight | Area | Classification | Comment |
|---|---|---|---|---|---|---|---|
| 10604 | 2004.05.03 | S18W28 | plage | ||||
| 10605 | 2004.05.04 | 6 | 5 | S11W70 | 0070 | DSO |
classification was CSO at midnight, area 0030 |
| 10606 | 2004.05.07 | 2 | 4 | S08E53 | 0160 | HSX |
classification was CSO at midnight |
| 10607 | 2004.05.09 | 3 | 1 | S11E00 | 0010 | BXO |
formerly region S400 classification was AXX at midnight, area 0000 |
| 10608 | 2004.05.09 | 6 | 9 | S04E68 | 0040 | CSO |
classification was CAO at midnight, area 0050 |
| S399 | emerged on 2004.05.06 |
S16W51 | plage | ||||
| Total spot count: | 17 | 19 | |||||
| SSN: | 57 | 59 | |||||
| Month | Average solar flux at Earth |
International sunspot number | Smoothed sunspot number |
|---|---|---|---|
| 2000.04 | 184.2 | 125.5 | 120.8 cycle 23 sunspot max. |
| 2000.07 | 202.3 | 170.1 | 119.8 |
| 2001.12 | 235.1 | 132.2 | 114.6 (-0.9) |
| 2003.04 | 126.4 | 60.0 | 70.1 (-3.9) |
| 2003.05 | 115.7 | 55.2 | 67.6 (-2.5) |
| 2003.06 | 129.3 | 77.4 | 65.0 (-2.6) |
| 2003.07 | 127.7 | 83.3 | 61.8 (-3.2) |
| 2003.08 | 122.1 | 72.7 | 60.0 (-1.8) |
| 2003.09 | 112.2 | 48.7 | 59.5 (-0.5) |
| 2003.10 | 151.7 | 65.5 | 58.1 (-1.4) |
| 2003.11 | 140.8 | 67.3 | (56.5 predicted, -1.6) |
| 2003.12 | 114.9 | 46.5 | (53.5 predicted, -3.0) |
| 2004.01 | 114.1 | 37.2 | (49.1 predicted, -4.4) |
| 2004.02 | 107.0 | 46.0 | (44.8 predicted, -4.3) |
| 2004.03 | 112.0 | 48.9 | (42.1 predicted, -2.7) |
| 2004.04 | 101.2 | 39.3 | (40.0 predicted, -2.1) |
| 2004.05 | 90.1 (1) | 13.7 (2) | (36.8 predicted, -3.2) |
1) Running average based on the daily 20:00 UTC observed solar flux value at 2800 MHz.
2) Unofficial, accumulated value based on the Boulder (NOAA/SEC) sunspot number. The official international sunspot number is typically
30-50% less.
This report has been prepared by Jan Alvestad. It is based partly on my own observations and analysis, and partly on data from some of these solar data sources. All time references are to the UTC day. Comments and suggestions are always welcome.
| [DX-Listeners' Club] |