
Last major update issued on May 26, 2004 at 04:20 UTC.
[Solar and geomagnetic data - last month (updated daily)]
[Solar wind and electron fluence charts (updated daily)]
[Solar cycles 21-23 (last update May 3, 2004)]
[Solar cycles 1-20]
[Graphical comparison of cycles 21, 22 and 23 (last update May 3, 2004)]
[Graphical comparison of cycles 2, 10, 13, 17, 20 and 23 (last update May 3, 2004)]
[Historical solar and geomagnetic data charts 1954-2004 (last update April 28,
2004)]
[Archived reports (last update May 18, 2004)]
The geomagnetic field was quiet to unsettled on May 25. Solar wind speed ranged between 414 and 552 km/sec under the influence of a high speed stream from coronal hole CH97. This stream ended at about 18h UTC.
Solar flux measured at 20h UTC on 2.8 GHz was 102.4. The planetary A
index was 8 (STAR Ap - based on the mean of three hour interval ap indices: 8.8).
Three hour interval K indices: 21333222 (planetary), 20222222 (Boulder).
The background x-ray flux is at the class B1-B2 level.
At midnight there were 5 spotted regions on the visible disk. The solar flare activity level was very low. No C class events were recorded during the day.
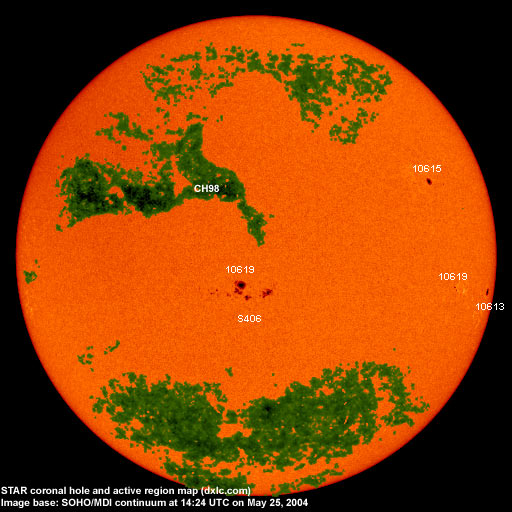
Region 10613 was quiet and stable as it rotated to the southwest limb.
Region 10615 decayed slowly and quietly.
Region 10618 decayed losing penumbral area. Several small spot disappeared in the leading spot section. There is still a
chance of a minor M class flare, however, the region has been mostly quiet after losing its magnetic delta structure 2 days ago.
Region 10619 was quiet and stable.
Spotted regions not numbered by NOAA/SEC:
[S406] This region emerged just south of region 10618 on May 24 and decayed slowly on May 25. Location at midnight:
S14W04.
May 23-25: No fully or partly Earth directed CME observed.
Coronal hole history (since late October 2002)
Compare today's report with the situation one solar rotation ago: 28
days ago 27 days ago 26 days ago
An elongated coronal hole (CH98) in the northern hemisphere will likely be in a geoeffective position on May 25-29.

Processed SOHO/EIT 284 image at 13:05 UTC on May 25. The darkest areas on the solar disk are likely coronal holes.
The geomagnetic field is expected to be quiet to unsettled on May 26-27 and quiet to active on May 28-June 1 due to effects from coronal hole CH98.
| Coronal holes (1) | Coronal mass ejections (2) | M and X class flares (3) |
1) Effects from a coronal hole could reach Earth within the next 5 days. When the high speed stream has arrived
the color changes to green.
2) Material from a CME is likely to impact Earth within 96 hours.
3) There is a possibility of either M or X class flares within the next 48 hours.
Green: 0-20% probability, Yellow: 20-60% probability, Red: 60-100% probability.
Long distance low and medium frequency (below 2 MHz) propagation along east-west paths over high and upper middle latitudes is poor. Propagation along long distance north-south paths is good. Trans Atlantic propagation conditions are monitored every night on 1470 kHz. Dominant stations tonight: Radio Vibraci�n (Venezuela) and CPN Radio (Per�). Very interesting conditions noted at local sunrise, particularly towards Brazil, Argentina and Per�. La Peruanisima on 1590 kHz was the best of 3 stations on that frequency and an unidentified Argentinean was noted on 1680 kHz. Other Spanish speaking unidentified stations were observed on 1430, 1520 and 1570 kHz. From North America WWZN Boston on 1510 kHz had a good signal while several of the usual Newfoundland stations were weak (560, 590, 740, 930 kHz).
Compare to the previous day's image.
Data for all numbered solar regions according to the Solar Region Summary provided by NOAA/SEC. Comments are my own, as is the STAR spot count (spots observed at or inside a few hours before midnight) and data for regions not numbered by SEC or where SEC has observed no spots. SEC active region numbers in the table below and in the active region map above are the historic SEC/USAF numbers.
| Active region | Date numbered | SEC spot count |
STAR spot count |
Location at midnight | Area | Classification | Comment |
|---|---|---|---|---|---|---|---|
| 10613 | 2004.05.13 | 1 | 1 | S09W81 | 0060 | HSX | |
| 10615 | 2004.05.16 | 1 | 1 | N17W53 | 0050 | HSX | |
| 10616 | 2004.05.16 | N07W48 | plage | ||||
| 10618 | 2004.05.20 | 46 | 47 | S10W00 | 0380 | FHC |
beta-gamma classification was FAI at midnight, area 0290 |
| 10619 | 2004.05.23 | 1 | 4 | S09W63 | 0020 | HRX |
classification was CSO at midnight |
| 10620 | 2004.05.23 | 2 | S15E08 | 0010 | CRO | spotless | |
| S406 | emerged on 2004.05.24 |
3 | S14W04 | 0000 | BXO | ||
| Total spot count: | 51 | 56 | |||||
| SSN: | 101 | 106 | |||||
| Month | Average solar flux at Earth |
International sunspot number | Smoothed sunspot number |
|---|---|---|---|
| 2000.04 | 184.2 | 125.5 | 120.8 cycle 23 sunspot max. |
| 2000.07 | 202.3 | 170.1 | 119.8 |
| 2001.12 | 235.1 | 132.2 | 114.6 (-0.9) |
| 2003.04 | 126.4 | 60.0 | 70.1 (-3.9) |
| 2003.05 | 115.7 | 55.2 | 67.6 (-2.5) |
| 2003.06 | 129.3 | 77.4 | 65.0 (-2.6) |
| 2003.07 | 127.7 | 83.3 | 61.8 (-3.2) |
| 2003.08 | 122.1 | 72.7 | 60.0 (-1.8) |
| 2003.09 | 112.2 | 48.7 | 59.5 (-0.5) |
| 2003.10 | 151.7 | 65.5 | 58.1 (-1.4) |
| 2003.11 | 140.8 | 67.3 | (56.5 predicted, -1.6) |
| 2003.12 | 114.9 | 46.5 | (53.5 predicted, -3.0) |
| 2004.01 | 114.1 | 37.2 | (49.1 predicted, -4.4) |
| 2004.02 | 107.0 | 46.0 | (44.8 predicted, -4.3) |
| 2004.03 | 112.0 | 48.9 | (42.1 predicted, -2.7) |
| 2004.04 | 101.2 | 39.3 | (40.0 predicted, -2.1) |
| 2004.05 | 99.6 (1) | 65.1 (2) | (36.8 predicted, -3.2) |
1) Running average based on the daily 20:00 UTC observed solar flux value at 2800 MHz.
2) Unofficial, accumulated value based on the Boulder (NOAA/SEC) sunspot number. The official international sunspot number is typically
30-50% less.
This report has been prepared by Jan Alvestad. It is based partly on my own observations and analysis, and partly on data from some of these solar data sources. All time references are to the UTC day. Comments and suggestions are always welcome.
| [DX-Listeners' Club] |