
Last major update issued on October 19, 2004 at 03:55 UTC.
[Solar and geomagnetic data - last month (updated daily)]
[Solar wind and electron fluence charts (updated daily)]
[Solar cycles 21-23 (last update October 2, 2004)]
[Solar cycles 1-20]
[Graphical comparison of cycles 21, 22 and 23 (last update October 2, 2004)]
[Graphical comparison of cycles 2, 10, 13, 17, 20 and 23 (last update October 2, 2004)]
[Historical solar and geomagnetic data charts 1954-2004 (last update August 28,
2004)]
[Archived reports (last update October 18, 2004)]
The geomagnetic field was inactive to quiet on October 18. Solar wind speed ranged between 285 and 332 km/sec. A low speed coronal hole (origin in coronal hole CH119) began around noon and caused a significant increase in auroral activity while other geomagnetic effects were minor. Early on October 19 the stream appears to have peaked.
Solar flux measured at 20h UTC on 2.8 GHz was 96.2. The planetary A
index was 4 (STAR Ap - based on the mean of three hour interval ap indices: 3.6).
Three hour interval K indices: 00011222 (planetary), 01012311 (Boulder).
The background x-ray flux is at the class B1 level.
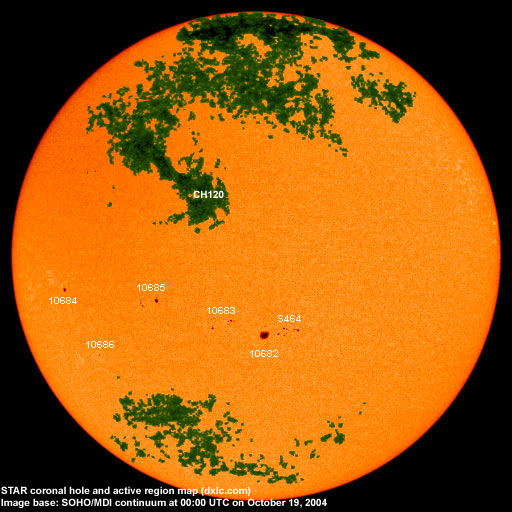
At midnight there were 6 spotted regions on the visible solar disk. The solar flare activity level was very low. No C class events were recorded during the day.
Region 10682 decayed further losing spots and penumbral area.
Region 10683 decayed quickly and could become spotless within a couple of days if the current rate of decay persists.
Region 10684 developed small trailing spots while the leading penumbra was mostly unchanged.
New region 10685 emerged in the southeast quadrant on October 17 and was numbered by SEC the following day. The region
developed on October 18 adding penumbra to both polarities and several spots.
New region 10686 rotated emerged near the southeast limb on October 16 and was noticed by SEC two days later. The region is
decaying and could soon become spotless.
Spotted regions not numbered by NOAA/SEC:
[S464] A new bipolar region emerged immediately to the west of region 10682 on October 18. Some interaction with region
10682 is possible if the region develops further. Location at midnight: S12W08.
October 17-19: No obviously Earth directed CMEs observed.
Coronal hole history (since late October 2002)
Compare today's report with the situation one solar rotation ago: 28
days ago 27 days ago 26 days ago
A poorly defined coronal hole (CH119) in the southern hemisphere was in a geoeffective position on October 14-15. A recurrent coronal hole (CH120) in the northern hemisphere will move into a geoeffective position on October 19-20.

Processed SOHO/EIT 284 image at 01:06 UTC on October 19. The darkest areas on the solar disk are likely coronal holes.
The geomagnetic field is expected to be quiet on October 19 slightly influenced by a very weak coronal hole stream and inactive to quiet on October 20-22. A recurrent high speed coronal hole stream (from coronal hole CH120) will likely reach Earth on October 23 and cause unsettled to active conditions during the latter half of that day and on October 24-25.
| Coronal holes (1) | Coronal mass ejections (2) | M and X class flares (3) |
1) Effects from a coronal hole could reach Earth within the next 5 days. When the high speed stream has arrived
the color changes to green.
2) Material from a CME is likely to impact Earth within 96 hours.
3) There is a possibility of either M or X class flares within the next 48 hours.
Green: 0-20% probability, Yellow: 20-60% probability, Red: 60-100% probability.
Long distance low and medium frequency (below 2 MHz) propagation along east-west paths over high and upper middle latitudes is fair. Propagation along long distance north-south paths is poor. Trans Atlantic propagation conditions are monitored every night on 1470 kHz. Dominant stations tonight: Radio Vibraci�n (Venezuela) and WLAM Lewiston ME, both with fairly weak signals. On other frequencies propagation was best towards Colombia, the Canadian Atlantic provinces, Greenland (good signals on 570 and 650 kHz), the northeastern coastal parts of the USA. The Newfoundland stations on 740 and 930 kHz had S9 signals.
Compare to the previous day's image.
Data for all numbered solar regions according to the Solar Region Summary provided by NOAA/SEC. Comments are my own, as is the STAR spot count (spots observed at or inside a few hours before midnight) and data for regions not numbered by SEC or where SEC has observed no spots. SEC active region numbers in the table below and in the active region map above are the historic SEC/USAF numbers.
| Active region | Date numbered | SEC spot count |
STAR spot count |
Location at midnight | Area | Classification | Comment |
|---|---|---|---|---|---|---|---|
| 10681 | 2004.10.12 | N10W88 | plage | ||||
| 10682 | 2004.10.13 | 15 | 8 | S13W03 | 0130 | DAO | |
| 10683 | 2004.10.17 | 10 | 7 | S10E08 | 0050 | DAO |
classification was DSO at midnight, area 0030 |
| 10684 | 2004.10.17 | 1 | 4 | S05E53 | 0020 | HAX |
classification was CSO at midnight, area 0040 |
| 10685 | 2004.10.18 | 9 | 9 | S05E26 | 0020 | CAO |
formerly region S463 area was 0040 at midnight |
| 10686 | 2004.10.18 | 1 | 1 | S20E43 | 0010 | AXX | formerly region S462 |
| S464 | emerged on 2004.10.18 |
7 | S12W08 | 0030 | DAO | ||
| Total spot count: | 36 | 36 | |||||
| SSN: | 86 | 96 | |||||
| Month | Average solar flux at Earth |
International sunspot number | Smoothed sunspot number |
|---|---|---|---|
| 2000.04 | 184.2 | 125.5 | 120.8 cycle 23 sunspot max. |
| 2000.07 | 202.3 | 170.1 | 119.8 |
| 2001.12 | 235.1 | 132.2 | 114.6 (-0.9) |
| 2003.08 | 122.1 | 72.7 | 60.0 (-1.7) |
| 2003.09 | 112.2 | 48.7 | 59.5 (-0.5) |
| 2003.10 | 151.7 | 65.5 | 58.2 (-1.3) |
| 2003.11 | 140.8 | 67.3 | 56.7 (-1.5) |
| 2003.12 | 114.9 | 46.5 | 54.8 (-1.9) |
| 2004.01 | 114.1 | 37.3 | 52.0 (-2.8) |
| 2004.02 | 107.0 | 45.8 | 49.3 (-2.7) |
| 2004.03 | 112.0 | 49.1 | 47.1 (-2.2) |
| 2004.04 | 101.2 | 39.3 | (44.6 predicted, -2.5) |
| 2004.05 | 99.8 | 41.5 | (40.9 predicted, -3.7) |
| 2004.06 | 97.4 | 43.2 | (38.0 predicted, -2.9) |
| 2004.07 | 119.1 | 51.0 | (36.2 predicted, -1.8) |
| 2004.08 | 109.6 | 40.9 | (34.6 predicted, -1.6) |
| 2004.09 | 103.1 | 27.7 | (32.8 predicted, -1.6) |
| 2004.10 | 90.1 (1) | 20.0 (2) | (30.5 predicted, -2.3) |
1) Running average based on the daily 20:00 UTC observed solar flux value at 2800 MHz.
2) Unofficial, accumulated value based on the Boulder (NOAA/SEC) sunspot number. The official international sunspot number is typically
30-50% less.
This report has been prepared by Jan Alvestad. It is based partly on my own observations and analysis, and partly on data from some of these solar data sources. All time references are to the UTC day. Comments and suggestions are always welcome.
| [DX-Listeners' Club] |