
Last major update issued on October 20, 2004 at 03:45 UTC.
[Solar and geomagnetic data - last month (updated daily)]
[Solar wind and electron fluence charts (updated daily)]
[Solar cycles 21-23 (last update October 2, 2004)]
[Solar cycles 1-20]
[Graphical comparison of cycles 21, 22 and 23 (last update October 2, 2004)]
[Graphical comparison of cycles 2, 10, 13, 17, 20 and 23 (last update October 2, 2004)]
[Historical solar and geomagnetic data charts 1954-2004 (last update August 28,
2004)]
[Archived reports (last update October 18, 2004)]
The geomagnetic field was very quiet to quiet on October 19. Solar wind speed ranged between 291 and 383 km/sec under the influence of a low speed stream from coronal hole CH119. The geomagnetic effects from the coronal flow are likely to become more noticeable early on October 20.
Solar flux measured at 20h UTC on 2.8 GHz was 99.1. The planetary A
index was 4 (STAR Ap - based on the mean of three hour interval ap indices: 4.3).
Three hour interval K indices: 01012211 (planetary), 11113311 (Boulder).
The background x-ray flux is at the class B4 level.
At midnight there were 8 spotted regions on the visible solar disk. The solar flare activity level was low. A total of 2 C class events was recorded during the day.
Region 10682 decayed further with only a few tiny spots outside of the single penumbra remaining. [Note that SEC has
failed to separate this decaying region from the quickly developing region S464.] Flare:
C1.0 at 02:54 UTC.
Region 10683 decayed further and could become spotless today.
Region 10684 decayed slightly, the plage in the region cooled.
Region 10685 developed in the leading spot section while decay was observed in the trailing spots.
Region 10686 was quiet and stable. The region could become spotless anytime.
New region 10687 rotated into view at the northeast limb. This region has displayed some activity and appears to have a
magnetic delta structure within the main penumbra. At least C class flaring is possible.
Spotted regions not numbered by NOAA/SEC:
[S464] A new bipolar region emerged immediately to the west of region 10682 on October 18. Quick development was observed
late on October 19. A minor M class flare is possible. Location at midnight: S12W23. Flare:
C1.9 at 14:28 UTC.
[S465] A new region emerged in the southwest quadrant on October 19. Location at midnight: S07W36.
October 18-20: No obviously Earth directed CMEs observed.
Coronal hole history (since late October 2002)
Compare today's report with the situation one solar rotation ago: 28
days ago 27 days ago 26 days ago
A poorly defined coronal hole (CH119) in the southern hemisphere was in a geoeffective position on October 14-15. A recurrent coronal hole (CH120) in the northern hemisphere was in a geoeffective position on October 19-20.

Processed SOHO/EIT 284 image at 19:06 UTC on October 19. The darkest areas on the solar disk are likely coronal holes.
The geomagnetic field is expected to be quiet to unsettled on October 20 and quiet on October 21-22. A recurrent high speed coronal hole stream (from coronal hole CH120) will likely reach Earth on October 23 and cause unsettled to active conditions during the latter half of that day and on October 24-25.
| Coronal holes (1) | Coronal mass ejections (2) | M and X class flares (3) |
1) Effects from a coronal hole could reach Earth within the next 5 days. When the high speed stream has arrived
the color changes to green.
2) Material from a CME is likely to impact Earth within 96 hours.
3) There is a possibility of either M or X class flares within the next 48 hours.
Green: 0-20% probability, Yellow: 20-60% probability, Red: 60-100% probability.
Long distance low and medium frequency (below 2 MHz) propagation along east-west paths over high and upper middle latitudes is fair to poor. Propagation along long distance north-south paths is fair to poor. Trans Atlantic propagation conditions are monitored every night on 1470 kHz. Dominant station tonight: Radio Vibraci�n (Venezuela). On other frequencies propagation was best towards the Caribbean and the easternmost parts of North America. Reception was best in the lower part of the band with good signals from Radio Visi�n Cristiana on 530, Radio Reloj (Cuba) on 570, Radio Reloj (Puerto Rico) on 580 and VOCM on 590 kHz.
Compare to the previous day's image.
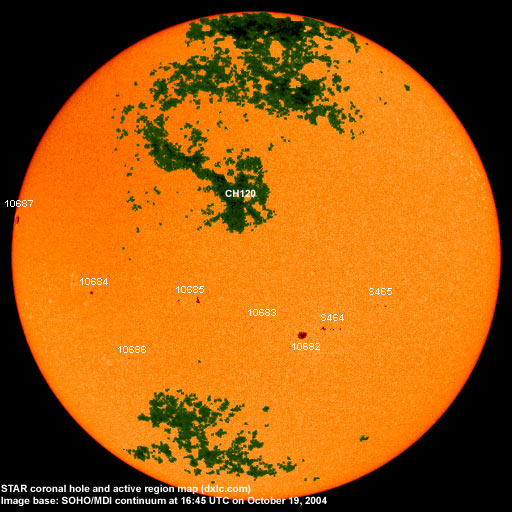
Data for all numbered solar regions according to the Solar Region Summary provided by NOAA/SEC. Comments are my own, as is the STAR spot count (spots observed at or inside a few hours before midnight) and data for regions not numbered by SEC or where SEC has observed no spots. SEC active region numbers in the table below and in the active region map above are the historic SEC/USAF numbers.
| Active region | Date numbered | SEC spot count |
STAR spot count |
Location at midnight | Area | Classification | Comment |
|---|---|---|---|---|---|---|---|
| 10682 | 2004.10.13 | 9 | 4 | S13W16 (SEC: S13W19) |
0120 | EAO |
classification was CAO at midnight SEC has included the spots of region S464 |
| 10683 | 2004.10.17 | 5 | 2 | S11W05 | 0060 | BXO |
classification was AXX at midnight, area 0010 |
| 10684 | 2004.10.17 | 2 | 4 | S04E41 | 0040 | CSO | |
| 10685 | 2004.10.18 | 7 | 7 | S06E12 | 0030 | CSO |
classification was CAO at midnight, area 0040 |
| 10686 | 2004.10.18 | 1 | 1 | S20E31 | 0010 | AXX | |
| 10687 | 2004.10.19 | 2 | 5 | N10E79 | 0120 | DAO |
beta-delta classification was DAC at midnight, area 0180 |
| S464 | emerged on 2004.10.18 |
14 | S12W22 | 0070 | DAI | ||
| S465 | emerged on 2004.10.19 |
6 | S07W36 | 0020 | DRO | ||
| Total spot count: | 26 | 43 | |||||
| SSN: | 86 | 123 | |||||
| Month | Average solar flux at Earth |
International sunspot number | Smoothed sunspot number |
|---|---|---|---|
| 2000.04 | 184.2 | 125.5 | 120.8 cycle 23 sunspot max. |
| 2000.07 | 202.3 | 170.1 | 119.8 |
| 2001.12 | 235.1 | 132.2 | 114.6 (-0.9) |
| 2003.08 | 122.1 | 72.7 | 60.0 (-1.7) |
| 2003.09 | 112.2 | 48.7 | 59.5 (-0.5) |
| 2003.10 | 151.7 | 65.5 | 58.2 (-1.3) |
| 2003.11 | 140.8 | 67.3 | 56.7 (-1.5) |
| 2003.12 | 114.9 | 46.5 | 54.8 (-1.9) |
| 2004.01 | 114.1 | 37.3 | 52.0 (-2.8) |
| 2004.02 | 107.0 | 45.8 | 49.3 (-2.7) |
| 2004.03 | 112.0 | 49.1 | 47.1 (-2.2) |
| 2004.04 | 101.2 | 39.3 | (44.6 predicted, -2.5) |
| 2004.05 | 99.8 | 41.5 | (40.9 predicted, -3.7) |
| 2004.06 | 97.4 | 43.2 | (38.0 predicted, -2.9) |
| 2004.07 | 119.1 | 51.0 | (36.2 predicted, -1.8) |
| 2004.08 | 109.6 | 40.9 | (34.6 predicted, -1.6) |
| 2004.09 | 103.1 | 27.7 | (32.8 predicted, -1.6) |
| 2004.10 | 90.6 (1) | 22.8 (2) | (30.5 predicted, -2.3) |
1) Running average based on the daily 20:00 UTC observed solar flux value at 2800 MHz.
2) Unofficial, accumulated value based on the Boulder (NOAA/SEC) sunspot number. The official international sunspot number is typically
30-50% less.
This report has been prepared by Jan Alvestad. It is based partly on my own observations and analysis, and partly on data from some of these solar data sources. All time references are to the UTC day. Comments and suggestions are always welcome.
| [DX-Listeners' Club] |