
Last major update issued on August 20, 2005 at 03:50 UTC.
[Solar and
geomagnetic data - last month (updated daily)]
[Solar wind and
electron fluence charts (updated daily)]
[Solar cycles 21-23
(last update August 2, 2005)]
[Solar cycles 1-20]
[Graphical comparison
of cycles 21, 22 and 23 (last update August 2, 2005)]
[Graphical
comparison of cycles 2, 10, 13, 17, 20 and 23 (last update August 2, 2005)]
[Historical solar and
geomagnetic data charts 1954-2004 (last update February 1, 2005)]
[Archived reports
(last update August 13, 2005)]
The geomagnetic field was quiet to unsettled on August 19. Solar wind speed ranged between 459 and 593 (all day average 529) km/sec, slowly decreasing all day.
Solar flux measured at 20h UTC on 2.8 GHz was 93.1. The planetary
A
index was 7 (STAR Ap - based on the mean of three hour interval ap
indices: 7.3).
Three hour interval K indices: 21232212 (planetary), 32233103 (Boulder).
The background x-ray flux is at the class B1 level.
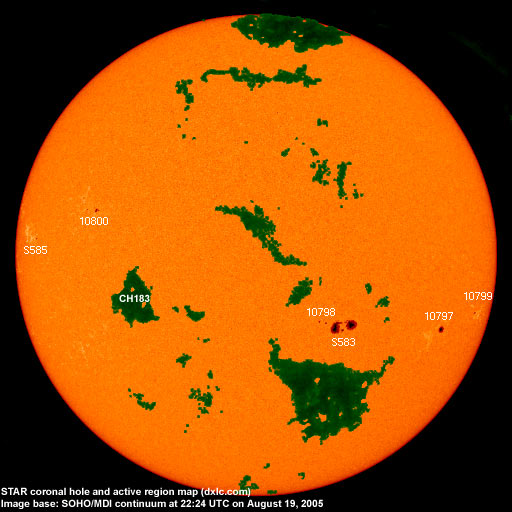
At midnight there were 6 spotted regions on the visible solar disk. The solar flare activity level was very low. No C class events were recorded during the day.
Region 10797 was quiet and stable.
Region 10798 decayed slowly. Note that SEC has included region S583 in this region.
Region 10799 developed slowly and quietly.
New region 10800 emerged in the northeast quadrant on August 18 and was numbered the next day by NOAA/SEC. Slow development
was observed on August 19.
Spotted regions not numbered by NOAA/SEC:
[S583] This is a quickly developing reversed polarity (maybe cycle 24?) region just west southwest of region 10798. The
first signs of the region were noted late on August 17. An M class flare is possible once polarities begin to intermix or a
magnetic delta develops. Location at midnight: S10W22
[S585] A new region emerged near the northeast limb on August 19. Location at midnight: N07E67.
August 17-19: No obvious partly or fully Earth directed CMEs were observed.
Coronal hole
history (since late October 2002)
Compare today's report with the situation one solar rotation ago: 28
days ago 27 days ago 26
days ago
A recurrent coronal hole (CH182) in the southern hemisphere was in an Earth facing position on August 17-18. While this coronal hole didn't produce any disturbance during the previous rotation, it has extended somewhat in a northerly direction. A recurrent coronal hole (CH183) in the southern hemisphere will likely rotate to an Earth facing position on August 21-22.

Processed SOHO/EIT 284 image at 01:06 UTC on August 19. The darkest areas on the solar disk are likely coronal holes.
The geomagnetic field is expected to be quiet to unsettled on August 20 becoming quiet to active on August 21-22 due to effects from CH182.
| Coronal holes (1) | Coronal mass ejections (2) | M and X class flares (3) |
1) Effects from a coronal hole could reach Earth
within the next 5 days. When the high speed stream has arrived
the color changes to green.
2) Material from a CME is likely to impact Earth within 96 hours.
3) There is a possibility of either M or X class flares within the next
48 hours.
Green: 0-20% probability, Yellow: 20-60% probability, Red: 60-100% probability.
Long distance low and medium frequency (below 2 MHz) propagation along east-west paths over high and upper middle latitudes is poor. Propagation on long distance northeast-southwest paths is poor to fair. Trans Atlantic propagation conditions are normally monitored every night on 1470 kHz. Dominant stations tonight: Radio Vibraci�n (Venezuela) with Uni�n Radio programming and Radio Cristal del Uruguay (both were audible as early as 22:30 UTC). Propagation was best towards Puerto Rico and Venezuela. Only a few North American stations were noted with the best signal from 800 VOWR, the first signals were audible before 23h UTC.
Compare to the previous day's image.
Data for all numbered solar regions according to the Solar Region Summary provided by NOAA/SEC. Comments are my own, as is the STAR spot count (spots observed at or inside a few hours before midnight) and data for regions not numbered by SEC or where SEC has observed no spots. SEC active region numbers in the table below and in the active region map above are the historic SEC/USAF numbers.
| Active region | Date numbered | SEC spot count |
STAR spot count |
Location at midnight | Area | Classification | Comment |
|---|---|---|---|---|---|---|---|
| 10797 | 2005.08.11 | 1 | 1 | S13W52 | 0110 | HSX | |
| 10798 | 2005.08.14 | 14 | 3 | S10W19 | 0160 | DAI |
classification was DSO at midnight, area 0030 SEC has included region S583 in this region location: S09W16 |
| 10799 | 2005.08.18 | 2 | 3 | S10W70 | 0020 | AXX | classification was CAO at midnight |
| 10800 | 2005.08.19 | 4 | 9 | N16E46 | 0030 | CAO | formerly region S584 |
| S583 | 2005.08.18 | 21 | S10W22 | 0500 | DKC | reversed polarity or cycle 24 region | |
| S585 | 2005.08.19 | 1 | N07E67 | 0010 | HRX | ||
| Total spot count: | 21 | 38 | |||||
| SSN: | 61 | 98 | |||||
| Month | Average solar flux at Earth |
International sunspot number | Smoothed sunspot number |
|---|---|---|---|
| 2000.04 | 184.2 | 125.5 | 120.8 cycle 23 sunspot max. |
| 2000.07 | 202.3 | 170.1 | 119.8 |
| 2001.12 | 235.1 | 132.2 | 114.6 (-0.9) |
| 2004.06 | 97.4 | 43.2 | 41.6 (-2.2) |
| 2004.07 | 119.1 | 51.1 | 40.2 (-1.4) |
| 2004.08 | 109.6 | 40.9 | 39.2 (-1.0) |
| 2004.09 | 103.1 | 27.7 | 37.5 (-1.7) |
| 2004.10 | 105.9 | 48.0 | 35.9 (-1.6) |
| 2004.11 | 113.2 | 43.5 | 35.3 (-0.6) |
| 2004.12 | 94.5 | 17.9 | 35.2 (-0.1) |
| 2005.01 | 102.2 | 31.3 | 34.6 (-0.6) |
| 2005.02 | 97.2 | 29.2 | (33.5 predicted, -1.1) |
| 2005.03 | 89.9 | 24.5 | (32.1 predicted, -1.4) |
| 2005.04 | 86.0 | 24.4 | (30.2 predicted, -1.9) |
| 2005.05 | 99.3 | 42.6 | (27.6 predicted, -2.6) |
| 2005.06 | 93.7 | 39.6 | (26.1 predicted, -1.5) |
| 2005.07 | 96.4 | 39.9 | (25.1 predicted, -1.0) |
| 2005.08 | 88.0 (1) | 36.4 (2) | (23.2 predicted, -1.9) |
1) Running average based on the daily 20:00 UTC observed solar flux
value at 2800 MHz.
2) Unofficial, accumulated value based on the Boulder (NOAA/SEC)
sunspot number. The official international sunspot number is typically
30-50% lower.
This report has been prepared by Jan Alvestad. It is based partly on my own observations and analysis, and partly on data from some of these solar data sources. All time references are to the UTC day. Comments and suggestions are always welcome.
| [DX-Listeners' Club] |