
Last major update issued on August 22, 2005 at 04:30 UTC. Minor update posted at at 17:15 UTC
[Solar and
geomagnetic data - last month (updated daily)]
[Solar wind and
electron fluence charts (updated daily)]
[Solar cycles 21-23
(last update August 2, 2005)]
[Solar cycles 1-20]
[Graphical comparison
of cycles 21, 22 and 23 (last update August 2, 2005)]
[Graphical
comparison of cycles 2, 10, 13, 17, 20 and 23 (last update August 2, 2005)]
[Historical solar and
geomagnetic data charts 1954-2004 (last update February 1, 2005)]
[Archived reports
(last update August 13, 2005)]
The geomagnetic field was quiet to active on August 21. Solar wind speed ranged between 349 and 565 (all day average 431) km/sec. A sudden increase in solar wind speed was observed near 15:20 UTC at ACE. Prior to that solar wind density had been slowly increasing for several hours. This was likely the arrival of the high speed stream associated with CH182.
Solar flux measured at 20h UTC on 2.8 GHz was 98.5. The planetary
A
index was 8 (STAR Ap - based on the mean of three hour interval ap
indices: 8.0).
Three hour interval K indices: 11112422 (planetary), 22222431 (Boulder).
The background x-ray flux is at the class B3 level.
At midnight there were 4 spotted regions on the visible solar disk. The solar flare activity level was low. A single C class event was recorded during the day.
Region 10797 decayed slowly and will rotate over the southwest limb early on August 22.
Region 10800 developed quickly adding many new spots. C flares are possible.
Region 10801 has a single small spot and could soon become spotless.
Spotted regions not numbered by NOAA/SEC:
[S583] This is a complex, compact reversed polarity region. Almost all spots are within a single large penumbra. This
penumbra has a strong magnetic delta structure. Further M class proton flares are possible. Location at midnight: S11W50. Flare:
C2.8 at 10:19 UTC. This region produced an M2.6 long duration event peaking at 01:33 on August 22. A weak enhancement in the above
10 MeV proton flux has been observed. A partly Earth directed CME was likely associated with this event.
Comment added at 17:15 UTC on August 22: Region S583 is the source of what could become a major long duration event, the current intensity is at the M4.1 level and increasing. A fast full halo CME was observed in LASCO images beginning at 02:18 UTC, this was associated with the M2 LDE early in the day. Another full halo CME was observed later on, perhaps with a backsided source.
August 19 and 21: No obvious partly or fully Earth directed CMEs were observed.
August 20: A faint full halo CME was observed in LASCO C3 images beginning at 18:45 UTC. There was no associated frontside
activity so this CME likely had a backsided source.
Coronal hole
history (since late October 2002)
Compare today's report with the situation one solar rotation ago: 28
days ago 27 days ago 26
days ago
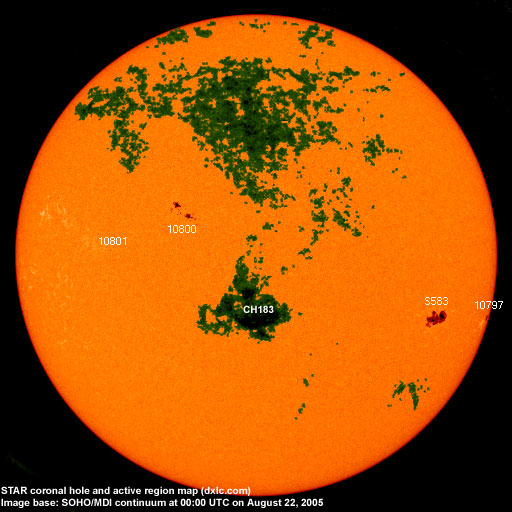
A recurrent coronal hole (CH182) in the southern hemisphere was in an Earth facing position on August 17-18. A recurrent coronal hole (CH183) in the southern hemisphere was in an Earth facing position on August 21-22.

Processed SOHO/EIT 284 image at 19:06 UTC on August 21. The darkest areas on the solar disk are likely coronal holes.
The geomagnetic field is expected to be quiet to active on August 22 due to effects from CH182. Quiet conditions are likely on August 23 with unsettled to minor storm expected for August 24-25 due to a high speed stream from CH183. If there was a CME associated with the LDE in region S583 early on Aug.22, it could reach Earth early on August 24 and cause a significant disturbance, active to severe storm levels are possible.
| Coronal holes (1) | Coronal mass ejections (2) | M and X class flares (3) |
1) Effects from a coronal hole could reach Earth
within the next 5 days. When the high speed stream has arrived
the color changes to green.
2) Material from a CME is likely to impact Earth within 96 hours.
3) There is a possibility of either M or X class flares within the next
48 hours.
Green: 0-20% probability, Yellow: 20-60% probability, Red: 60-100% probability.
Long distance low and medium frequency (below 2 MHz) propagation along east-west paths over high and upper middle latitudes is poor. Propagation on long distance northeast-southwest paths is fair. Trans Atlantic propagation conditions are normally monitored every night on 1470 kHz. Dominant stations tonight: Radio Cristal del Uruguay, Radio Vibraci�n (Venezuela) and LT28 Rafaela Argentina. Propagation was best towards Venezuela, Colombia and Argentina before and after LSR. Earlier in the night most of the usual Newfoundland stations were noted with fair signals, WWZN on 1510 was there as well but had company from an unidentified Latin American station.
Compare to the previous day's image.
Data for all numbered solar regions according to the Solar Region Summary provided by NOAA/SEC. Comments are my own, as is the STAR spot count (spots observed at or inside a few hours before midnight) and data for regions not numbered by SEC or where SEC has observed no spots. SEC active region numbers in the table below and in the active region map above are the historic SEC/USAF numbers.
| Active region | Date numbered | SEC spot count |
STAR spot count |
Location at midnight | Area | Classification | Comment |
|---|---|---|---|---|---|---|---|
| 10797 | 2005.08.11 | 1 | 1 | S14W78 | 0080 | HAX | area was 0050 at midnight |
| 10798 | 2005.08.14 | 18 | S11W48 | 0560 | DKC |
spotless SEC has included nearby region S583 in this region location: S09W42 |
|
| 10800 | 2005.08.19 | 17 | 28 | N17E19 | 0030 | CSO | classification was DAI at midnight, area 0170 |
| 10801 | 2005.08.20 | 1 | 1 | N07E38 | 0010 | AXX | |
| S583 | 2005.08.18 | 33 | S11W50 | 0600 | DKC |
beta-delta reversed polarity region |
|
| Total spot count: | 37 | 63 | |||||
| SSN: | 77 | 103 | |||||
| Month | Average solar flux at Earth |
International sunspot number | Smoothed sunspot number |
|---|---|---|---|
| 2000.04 | 184.2 | 125.5 | 120.8 cycle 23 sunspot max. |
| 2000.07 | 202.3 | 170.1 | 119.8 |
| 2001.12 | 235.1 | 132.2 | 114.6 (-0.9) |
| 2004.06 | 97.4 | 43.2 | 41.6 (-2.2) |
| 2004.07 | 119.1 | 51.1 | 40.2 (-1.4) |
| 2004.08 | 109.6 | 40.9 | 39.2 (-1.0) |
| 2004.09 | 103.1 | 27.7 | 37.5 (-1.7) |
| 2004.10 | 105.9 | 48.0 | 35.9 (-1.6) |
| 2004.11 | 113.2 | 43.5 | 35.3 (-0.6) |
| 2004.12 | 94.5 | 17.9 | 35.2 (-0.1) |
| 2005.01 | 102.2 | 31.3 | 34.6 (-0.6) |
| 2005.02 | 97.2 | 29.2 | (33.5 predicted, -1.1) |
| 2005.03 | 89.9 | 24.5 | (32.1 predicted, -1.4) |
| 2005.04 | 86.0 | 24.4 | (30.2 predicted, -1.9) |
| 2005.05 | 99.3 | 42.6 | (27.6 predicted, -2.6) |
| 2005.06 | 93.7 | 39.6 | (26.1 predicted, -1.5) |
| 2005.07 | 96.4 | 39.9 | (25.1 predicted, -1.0) |
| 2005.08 | 89.0 (1) | 41.3 (2) | (23.2 predicted, -1.9) |
1) Running average based on the daily 20:00 UTC observed solar flux
value at 2800 MHz.
2) Unofficial, accumulated value based on the Boulder (NOAA/SEC)
sunspot number. The official international sunspot number is typically
30-50% lower.
This report has been prepared by Jan Alvestad. It is based partly on my own observations and analysis, and partly on data from some of these solar data sources. All time references are to the UTC day. Comments and suggestions are always welcome.
| [DX-Listeners' Club] |