
Last major update issued on January 2, 2005 at 02:45 UTC.
[Solar and geomagnetic data - last month (updated daily)]
[Solar wind and electron fluence charts (updated daily)]
[Solar cycles 21-23 (last update January 2, 2005)]
[Solar cycles 1-20]
[Graphical comparison of cycles 21, 22 and 23 (last update January 2, 2005)]
[Graphical comparison of cycles 2, 10, 13, 17, 20 and 23 (last update January
2, 2005)]
[Historical solar and geomagnetic data charts 1954-2004 (last update November 8,
2004)]
[Archived reports (last update January 2, 2005)]
The geomagnetic field was quiet to active on January 1. Solar wind speed ranged between 429 and 693 km/sec. A high speed stream from coronal hole CH137 arrived at 10h UTC and caused an increase in geomagnetic activity. A solar wind shock was noted at SOHO at 22:33 UTC with a sudden increase in solar wind speed from 479 to 574 km/sec. This shock was likely associated with the halo CME observed after an M4 event in region 10715 on December 30.
Solar flux measured at 20h UTC on 2.8 GHz was 98.9. The planetary A
index was 15 (STAR Ap - based on the mean of three hour interval ap indices: 15.4).
Three hour interval K indices: 14323343 (planetary), 14323343 (Boulder).
The background x-ray flux is at the class B1-B2 level.
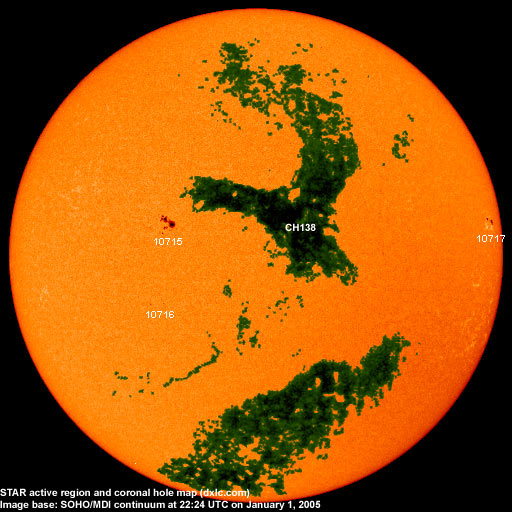
At midnight there were 3 spotted regions on the visible solar disk. The solar flare activity level was high. A total of 2 C and 1 X class events were recorded during the day. Solar activity became high a few minutes into the new year as region 10715 produced a major X1.7 flare (which began at 00:23 and peaked at 00:31 UTC). This event was preceded by a C1.5 flare (which began at 00:01 and peaked at 00:11 UTC) in the same region.
Region 10715 did not change much and remains fairly complex and capable of producing M class flares. Flares: C1.5 at 00:11, major X1.7 at 00:31 (associated with moderate type II and IV radio sweeps) and C1.2 at 14:24 UTC.
January 1: A large, fast, partially Earth directed CME is likely to have been associated with the X1.7 event early in the
day and could reach Earth late on January 2 or early on January 3.
December 31: No obvious Earth directed CMEs were observed during the first 16 hours of the day.
December 30: A full halo CME was observed after the M2.2 event in region 10715 before noon. The CME was faint over the poles
and the west limbs. Another, larger and faster, CME was observed after the M4 event in region 10715 late in the day. Although the
cores of these CMEs won't reach Earth, the flanking impacts are likely to cause minor geomagnetic disturbances on January 1 and 2.
Coronal hole history (since late October 2002)
Compare today's report with the situation one solar rotation ago: 28
days ago 27 days ago 26 days ago
A poorly defined extension (CH137) of a coronal hole in the northern hemisphere was in a geoeffective position on December 29. Recurrent large trans equatorial coronal hole CH136 was in a geoeffective position on December 31-January 2.

Processed SOHO/EIT 284 image at 19:06 UTC on January 1. The darkest areas on the solar disk are likely coronal holes.
The geomagnetic field is expected to be unsettled to minor storm on January 2-5 due to CMEs and coronal hole effects.
| Coronal holes (1) | Coronal mass ejections (2) | M and X class flares (3) |
1) Effects from a coronal hole could reach Earth within the next 5 days. When the high speed stream has arrived
the color changes to green.
2) Material from a CME is likely to impact Earth within 96 hours.
3) There is a possibility of either M or X class flares within the next 48 hours.
Green: 0-20% probability, Yellow: 20-60% probability, Red: 60-100% probability.
Long distance low and medium frequency (below 2 MHz) propagation along east-west paths over high and upper middle latitudes is very poor. Propagation along long distance north-south paths is poor to fair. Trans Atlantic propagation conditions are normally monitored every night on 1470 kHz. Dominant station tonight: Unidentified station from Brazil. On other frequencies a few stations from Brazil and Argentina were audible, 930 kHz had both R�dio Metropolitana (Fortaleza) and CBN (Aracaju) with fair signals.
Compare to the previous day's image.
Data for all numbered solar regions according to the Solar Region Summary provided by NOAA/SEC. Comments are my own, as is the STAR spot count (spots observed at or inside a few hours before midnight) and data for regions not numbered by SEC or where SEC has observed no spots. SEC active region numbers in the table below and in the active region map above are the historic SEC/USAF numbers.
| Active region | Date numbered | SEC spot count |
STAR spot count |
Location at midnight | Area | Classification | Comment |
|---|---|---|---|---|---|---|---|
| 10715 | 2004.12.28 | 16 | 15 | N05E21 | 0180 | DAC | beta-gamma |
| 10716 | 2004.12.30 | 1 | 2 | S14E24 | 0020 | DSO |
classification was BXO at midnight, area 0010 SEC classification is invalid with only 1 spot |
| 10717 | 2004.12.31 | 4 | 5 | N07W73 | 0030 | CAO |
classification was DAO at midnight, area 0060 |
| S491 | emerged on 2004.12.26 |
S16W63 | plage | ||||
| Total spot count: | 21 | 22 | |||||
| SSN: | 51 | 52 | |||||
| Month | Average solar flux at Earth |
International sunspot number | Smoothed sunspot number |
|---|---|---|---|
| 2000.04 | 184.2 | 125.5 | 120.8 cycle 23 sunspot max. |
| 2000.07 | 202.3 | 170.1 | 119.8 |
| 2001.12 | 235.1 | 132.2 | 114.6 (-0.9) |
| 2003.11 | 140.8 | 67.3 | 56.7 (-1.5) |
| 2003.12 | 114.9 | 46.5 | 54.8 (-1.9) |
| 2004.01 | 114.1 | 37.3 | 52.0 (-2.8) |
| 2004.02 | 107.0 | 45.8 | 49.3 (-2.7) |
| 2004.03 | 112.0 | 49.1 | 47.1 (-2.2) |
| 2004.04 | 101.2 | 39.3 | 45.5 (-1.6) |
| 2004.05 | 99.8 | 41.5 | 43.9 (-1.6) |
| 2004.06 | 97.4 | 43.2 | 41.7 (-2.2) |
| 2004.07 | 119.1 | 51.0 | (39.6 predicted, -1.9) |
| 2004.08 | 109.6 | 40.9 | (38.0 predicted, -1.6) |
| 2004.09 | 103.1 | 27.7 | (36.1 predicted, -1.9) |
| 2004.10 | 105.9 | 48.4 | (33.9 predicted, -2.2) |
| 2004.11 | 113.2 | 43.7 | (32.0 predicted, -1.9) |
| 2004.12 | 94.5 | 17.9 | (29.7 predicted, -2.3) |
| 2005.01 | 98.9 (1) | 1.6 (2) | (27.0 predicted, -2.7) |
1) Running average based on the daily 20:00 UTC observed solar flux value at 2800 MHz.
2) Unofficial, accumulated value based on the Boulder (NOAA/SEC) sunspot number. The official international sunspot number is typically
30-50% less.
This report has been prepared by Jan Alvestad. It is based partly on my own observations and analysis, and partly on data from some of these solar data sources. All time references are to the UTC day. Comments and suggestions are always welcome.
| [DX-Listeners' Club] |