
Last major update issued on July 31, 2005 at 05:30 UTC.
[Solar and
geomagnetic data - last month (updated daily)]
[Solar wind and
electron fluence charts (updated daily)]
[Solar cycles 21-23
(last update July 2, 2005)]
[Solar cycles 1-20]
[Graphical comparison
of cycles 21, 22 and 23 (last update July 2, 2005)]
[Graphical
comparison of cycles 2, 10, 13, 17, 20 and 23 (last update July 2, 2005)]
[Historical solar and
geomagnetic data charts 1954-2004 (last update February 1, 2005)]
[Archived reports
(last update July 19, 2005)]
The geomagnetic field was quiet to active on July 30. Solar wind speed ranged between 458 and 568 (all day average 501) km/sec, decreasingly under the influence of a high speed stream from CH177.
Solar flux measured at 20h UTC on 2.8 GHz was 105.0. The planetary
A
index was 16 (STAR Ap - based on the mean of three hour interval ap
indices: 16.3).
Three hour interval K indices: 44431122 (planetary), 44542222 (Boulder).
The background x-ray flux is at the class B2 level.
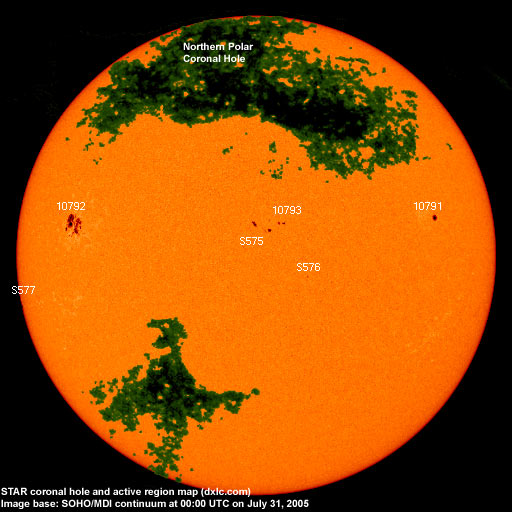
At midnight there were 6 spotted regions on the visible solar disk. The solar flare activity level was high. A total of 4 C and 1 X class events was recorded during the day.
Region 10791 decayed slowly and quietly.
Region 10792 developed with new penumbra forming in the leading spot section. The region remains capable of producing a major proton flare and has
2 or 3 magnetic delta structures. Flares: C9.4/1N at 05:19, major long duration X1.3/2B event
peaking at 06:35 (with associated moderate type IV and strong type II radio sweeps as well as a large CME), C1.5 at 12:25, C1.3 at
13:53 and a long duration C8.9 event peaking at 17:07 UTC.
Region 10793 developed slowly. SEC has combined this and region S575 into one region despite of the presence of two
distinct bipolar systems.
Spotted regions not numbered by NOAA/SEC:
[S575] This region emerged just east of region 10793 on July 29 and developed slowly on July 30. Location at midnight:
N13W02.
[S576] A new region emerged in the northwest quadrant on July 30. Location at midnight: N01W13
[S577] This region rotated partly into view at the southeast limb late on July 30. Location at midnight: S11E84
July 28-29: No obvious partly or fully Earth directed CMEs were observed.
July 30: A large and wide full halo CME was observed after the X1 flare in region 10792 early in the day. LASCO C3 images
shows the CME emerging at the northeast limb at 07:00 UTC.
Coronal hole
history (since late October 2002)
Compare today's report with the situation one solar rotation ago: 28
days ago 27 days ago 26
days ago
No obvious coronal holes are currently in or near Earth facing positions.

Processed SOHO/EIT 284 image at 01:06 UTC on July 31. The darkest areas on the solar disk are likely coronal holes.
The geomagnetic field is expected to be quiet to unsettled on July 31. The halo CME observed on July 30 will likely reach Earth during the first half of August 1 and cause active to major storm conditions. Quiet to active is likely on August 2.
| Coronal holes (1) | Coronal mass ejections (2) | M and X class flares (3) |
1) Effects from a coronal hole could reach Earth
within the next 5 days. When the high speed stream has arrived
the color changes to green.
2) Material from a CME is likely to impact Earth within 96 hours.
3) There is a possibility of either M or X class flares within the next
48 hours.
Green: 0-20% probability, Yellow: 20-60% probability, Red: 60-100% probability.
Long distance low and medium frequency (below 2 MHz) propagation along east-west paths over high and upper middle latitudes is poor. Propagation on long distance north-south paths is fair to very good. Trans Atlantic propagation conditions are normally monitored every night on 1470 kHz. Dominant stations tonight: Radio Cristal del Uruguay and Radio Vibraci�n (Venezuela). Lots of stations from Argentina were heard on other frequencies, particularly below 1200 kHz. The strongest signals were noted from 700 Radio C�rdoba, 710 Radio Diez (actually an excellent signal with no traces of splatter from Europeans on 711 kHz), 790 Radio Mitre, 870 Radio Nacional, 910 La Red, 950 Radio Belgrano and 1190 Radio Am�rica. Interesting stations were weakly audible on 560, 570, 820 and 830 kHz. Switching to a combo of my (NNW) EWE and (W) Super Delta changed the listening scenario considerably with several stations from Newfoundland (620, 710, 740, 800 and 930) with clear, although weak audio. WWZN 1510 had a nice signal and there were interesting carriers on numerous frequencies. Several stations from Venezuela were noted with fair signals including 910, 1470, 1500 and 1590 kHz.
Compare to the previous day's image.
Data for all numbered solar regions according to the Solar Region Summary provided by NOAA/SEC. Comments are my own, as is the STAR spot count (spots observed at or inside a few hours before midnight) and data for regions not numbered by SEC or where SEC has observed no spots. SEC active region numbers in the table below and in the active region map above are the historic SEC/USAF numbers.
| Active region | Date numbered | SEC spot count |
STAR spot count |
Location at midnight | Area | Classification | Comment |
|---|---|---|---|---|---|---|---|
| 10791 | 2005.07.23 | 4 | 1 | N14W48 | 0070 | CSO | classification was HSX at midnight |
| 10792 | 2005.07.28 | 19 | 34 | N12E52 | 0440 | DAC |
beta-gamma-delta classification was DKC at midnight, area 0640 location: N11E50 |
| 10793 | 2005.07.29 | 9 | 6 | N14W01 | 0070 | DSO |
area was 0030 at midnight, SEC has combined this and region S575 location: N14W05 |
| S575 | 2005.07.29 | 11 | N13W02 | 0070 | DAI | ||
| S576 | 2005.07.30 | 1 | N01W13 | 0010 | AXX | ||
| S577 | 2005.07.30 | 1 | S11E84 | 0080 | HAX | ||
| Total spot count: | 32 | 54 | |||||
| SSN: | 62 | 114 | |||||
| Month | Average solar flux at Earth |
International sunspot number | Smoothed sunspot number |
|---|---|---|---|
| 2000.04 | 184.2 | 125.5 | 120.8 cycle 23 sunspot max. |
| 2000.07 | 202.3 | 170.1 | 119.8 |
| 2001.12 | 235.1 | 132.2 | 114.6 (-0.9) |
| 2004.05 | 99.8 | 41.5 | 43.8 (-1.7) |
| 2004.06 | 97.4 | 43.2 | 41.6 (-2.2) |
| 2004.07 | 119.1 | 51.1 | 40.2 (-1.4) |
| 2004.08 | 109.6 | 40.9 | 39.2 (-1.0) |
| 2004.09 | 103.1 | 27.7 | 37.5 (-1.7) |
| 2004.10 | 105.9 | 48.0 | 35.9 (-1.6) |
| 2004.11 | 113.2 | 43.5 | 35.3 (-0.6) |
| 2004.12 | 94.5 | 17.9 | 35.2 (-0.1) |
| 2005.01 | 102.2 | 31.3 | (34.6 predicted, -0.6) |
| 2005.02 | 97.2 | 29.1 | (33.3 predicted, -1.3) |
| 2005.03 | 89.9 | 24.8 | (31.6 predicted, -1.7) |
| 2005.04 | 86.0 | 24.4 | (29.7 predicted, -1.9) |
| 2005.05 | 99.3 | 42.6 | (27.2 predicted, -2.5) |
| 2005.06 | 93.7 | 39.3 | (25.7 predicted, -1.5) |
| 2005.07 | 96.0 (1) | 65.2 (2) | (24.7 predicted, -1.0) |
1) Running average based on the daily 20:00 UTC observed solar flux
value at 2800 MHz.
2) Unofficial, accumulated value based on the Boulder (NOAA/SEC)
sunspot number. The official international sunspot number is typically
30-50% lower.
This report has been prepared by Jan Alvestad. It is based partly on my own observations and analysis, and partly on data from some of these solar data sources. All time references are to the UTC day. Comments and suggestions are always welcome.
| [DX-Listeners' Club] |