
Last major update issued on June 13, 2005 at 04:20 UTC.
[Solar and
geomagnetic data - last month (updated daily)]
[Solar wind and
electron fluence charts (updated daily)]
[Solar cycles 21-23
(last update June 4, 2005)]
[Solar cycles 1-20]
[Graphical comparison
of cycles 21, 22 and 23 (last update June 4, 2005)]
[Graphical
comparison of cycles 2, 10, 13, 17, 20 and 23 (last update June 4, 2005)]
[Historical solar and
geomagnetic data charts 1954-2004 (last update February 1, 2005)]
[Archived reports
(last update June 4, 2005)]
The geomagnetic field was quiet to major storm on June 12. Solar wind speed ranged between 281 and 549 km/sec. A solar wind shock was observed at 06:58 UTC at SOHO. This was the arrival of one of the CMEs observed on June 8 and 9. Initially the disturbance was not very impressive, then, after 12h UTC, strong southward fluctuations were observed in the interplanetary magnetic field. After 16h UTC the IMF has been moderately to strong southwards causing minor to major geomagnetic storming.
Solar flux measured at 20h UTC on 2.8 GHz was 103.0. The planetary
A
index was 35 (STAR Ap - based on the mean of three hour interval ap
indices: 34.8).
Three hour interval K indices: 22444556 (planetary), 12443555 (Boulder).
The background x-ray flux is at the class B1 level.
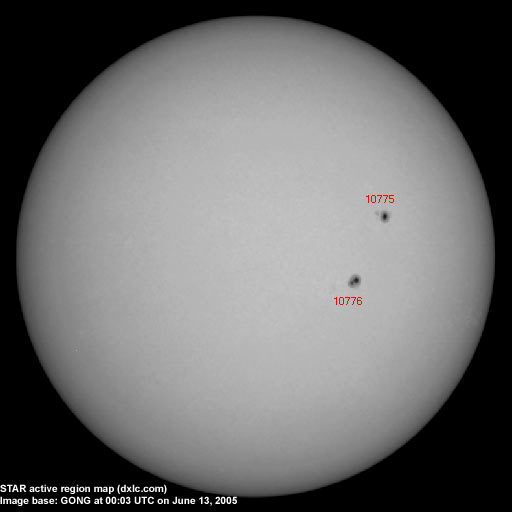
At midnight there were 2 spotted regions on the visible solar disk. The solar flare activity level was low. A total of 2 C class events was recorded during the day.
Region 10775 decayed after the long duration events. Flares: C3.5 very long duration
event peaking at 02:36 and C3.0 long duration event peaking at 16:09 UTC.
Region 10776 decayed and lost many spots in the trailing spot section.
June 11-12: Nothing observable due to no new LASCO images. Earth directed CMEs may have been associated with the long
duration events in region 10775 on June 12.
June 10: No obvious fully or partly Earth directed CMEs were observed in LASCO images.
Coronal hole
history (since late October 2002)
Compare today's report with the situation one solar rotation ago: 28
days ago 27 days ago 26
days ago
No obvious coronal holes are currently near Earth facing positions.

Processed SOHO/EIT 284 image at 01:06 UTC on June 6. The darkest areas on the solar disk are likely coronal holes.
The geomagnetic field is expected to be unsettled to minor storm on June 13 and quiet to unsettled on June 14-15. If the LDEs on June 12 were associated with CMEs, the CMEs could impact Earth on June 15 and cause a significant increase in geomagnetic actvity.
| Coronal holes (1) | Coronal mass ejections (2) | M and X class flares (3) |
1) Effects from a coronal hole could reach Earth
within the next 5 days. When the high speed stream has arrived
the color changes to green.
2) Material from a CME is likely to impact Earth within 96 hours.
3) There is a possibility of either M or X class flares within the next
48 hours.
Green: 0-20% probability, Yellow: 20-60% probability, Red: 60-100% probability.
Long distance low and medium frequency (below 2 MHz) propagation along east-west paths over high and upper middle latitudes is useless. Propagation along long distance north-south paths is very poor. Trans Atlantic propagation conditions are normally monitored every night on 1470 kHz. Dominant station tonight: Radio Cristal del Uruguay was noted with only a very weak to weak signal. Only a few other stations from Brazil (R�dio Nove de Julho on 1600 kHz had the best signal) and Uruguay could be heard.
Compare to the previous day's image.
Data for all numbered solar regions according to the Solar Region Summary provided by NOAA/SEC. Comments are my own, as is the STAR spot count (spots observed at or inside a few hours before midnight) and data for regions not numbered by SEC or where SEC has observed no spots. SEC active region numbers in the table below and in the active region map above are the historic SEC/USAF numbers.
| Active region | Date numbered | SEC spot count |
STAR spot count |
Location at midnight | Area | Classification | Comment |
|---|---|---|---|---|---|---|---|
| 10773 | 2005.06.01 | 2 | S15W67 | 0040 | HSX | spotless | |
| 10775 | 2005.06.04 | 17 | 16 | N10W32 | 0360 | DHC | |
| 10776 | 2005.06.05 | 36 | 23 | S06W21 | 0440 | EKI | classification was DKO at midnight |
| 10777 | 2005.06.10 | N05E28 | plage | ||||
| S555 | 2005.06.07 | S03W67 | plage | ||||
| S556 | 2005.06.09 | N05W34 | plage | ||||
| Total spot count: | 55 | 39 | |||||
| SSN: | 85 | 59 | |||||
| Month | Average solar flux at Earth |
International sunspot number | Smoothed sunspot number |
|---|---|---|---|
| 2000.04 | 184.2 | 125.5 | 120.8 cycle 23 sunspot max. |
| 2000.07 | 202.3 | 170.1 | 119.8 |
| 2001.12 | 235.1 | 132.2 | 114.6 (-0.9) |
| 2004.04 | 101.2 | 39.3 | 45.5 (-1.6) |
| 2004.05 | 99.8 | 41.5 | 43.8 (-1.7) |
| 2004.06 | 97.4 | 43.2 | 41.6 (-2.2) |
| 2004.07 | 119.1 | 51.1 | 40.2 (-1.4) |
| 2004.08 | 109.6 | 40.9 | 39.2 (-1.0) |
| 2004.09 | 103.1 | 27.7 | 37.5 (-1.7) |
| 2004.10 | 105.9 | 48.0 | 35.9 (-1.6) |
| 2004.11 | 113.2 | 43.5 | 35.3 (-0.6) |
| 2004.12 | 94.5 | 17.9 | (34.8 predicted, -0.5) |
| 2005.01 | 102.2 | 31.3 | (32.8 predicted, -2.0) |
| 2005.02 | 97.2 | 29.1 | (30.4 predicted, -2.4) |
| 2005.03 | 89.9 | 24.8 | (28.8 predicted, -1.6) |
| 2005.04 | 86.0 | 24.4 | (26.9 predicted, -1.9) |
| 2005.05 | 99.3 | 42.6 | (24.3 predicted, -2.6) |
| 2005.06 | 104.9 (1) | 34.2 (2) | (22.8 predicted, -1.5) |
1) Running average based on the daily 20:00 UTC observed solar flux
value at 2800 MHz.
2) Unofficial, accumulated value based on the Boulder (NOAA/SEC)
sunspot number. The official international sunspot number is typically
30-50% lower.
This report has been prepared by Jan Alvestad. It is based partly on my own observations and analysis, and partly on data from some of these solar data sources. All time references are to the UTC day. Comments and suggestions are always welcome.
| [DX-Listeners' Club] |