
Last major update issued on September 9, 2005 at 03:55 UTC.
[Solar and
geomagnetic data - last month (updated daily)]
[Solar wind and
electron fluence charts (updated daily)]
[Solar cycles 21-23
(last update September 3, 2005)]
[Solar cycles 1-20]
[Graphical comparison
of cycles 21, 22 and 23 (last update September 3, 2005)]
[Graphical
comparison of cycles 2, 10, 13, 17, 20 and 23 (last update September 3,
2005)]
[Historical solar and
geomagnetic data charts 1954-2004 (last update February 1, 2005)]
[Archived reports
(last update September 2 , 2005)]
The geomagnetic field was quiet to unsettled on September 8. Solar wind speed ranged between 332 and 401 (all day average 360) km/sec.
Solar flux measured at 20h UTC on 2.8 GHz was 94.1. The planetary
A
index was 8 (STAR Ap - based on the mean of three hour interval ap
indices: 7.8).
Three hour interval K indices: 32111223 (planetary), 22113322 (Boulder).
The background x-ray flux is at the class C2 level.
At midnight there were 2 spotted regions on the visible solar disk. The solar flare activity level was high. A total of 6 C, 2 M and 1 X class events was recorded during the day.
Region 10808 is large, compact and very complex with multiple magnetic delta structures within the same penumbra. There is
a high likelihood of further X class flaring. Flares: C2.9 at 11:17, C2.0 at 12:58, C4.0 at
14:36, C1.9 at 14:52, M2.1 at 17:03, M2.1 at 20:29 and major X5.4 at 21:06 UTC. The X flare was associated with a type IV radio
sweep and a large CME. (So far on September 9 the region has produced these flares: C6.2 at 00:32, M1.0 at 02:17, M1.1 at 02:35,
X1.1 at 03:00 and M1.3 at 03:43 UTC)
New region 10809 rotated into view at the northeast limb on September 6 and was noticed by SEC two days later.
September 6: A CME was observed over the west limbs following a long duration C2 event in region 10803
during the afternoon on September 4. A backsided, large full halo CME was observed after the LDE in old region 10798 behind the
southeast limb near noon on September 5.
September 7: While no LASCO images for the hours after the monster X flare in region 10808 are currently available,
previous CMEs from this region (while on the backside of the sun) were all wide and fast. There is no reason to believe that this
CME wasn't as fast and large. Even when considering that this was a limb event, a glancing impact on Earth is possible from late
on September 8 until the afternoon on September 9.
September 8: Another large CME may have been associated with the X5 flare in region 10808 during the evening. This CME
could reach Earth on September 10.
Coronal hole
history (since late October 2002)
Compare today's report with the situation one solar rotation ago: 28
days ago 27 days ago 26
days ago
A poorly defined recurrent coronal hole (CH186) in the northern hemisphere near the equator was in an Earth facing position on September 5-6. A recurrent trans equatorial coronal hole (CH187) will rotate to an Earth facing position on September 9-11.

Processed TRACE mosaic image on September 6, 2005. The darkest areas on the solar disk are likely coronal holes.
The geomagnetic field is expected to be quiet to active on September 9 due to effects from CH186. If there is a glancing impact from the likely very large CME associated with the X17 event on September 7, we could see active to major storm conditions on September 9. Unsettled to major and occasionally severe storm conditions are likely September 10-22 due to activity in region 10808. During the same time interval intense particle storms could have a huge impact on propagation conditions over most middle and high latitude paths.
| Coronal holes (1) | Coronal mass ejections (2) | M and X class flares (3) |
1) Effects from a coronal hole could reach Earth
within the next 5 days. When the high speed stream has arrived
the color changes to green.
2) Material from a CME is likely to impact Earth within 96 hours.
3) There is a possibility of either M or X class flares within the next
48 hours.
Green: 0-20% probability, Yellow: 20-60% probability, Red: 60-100% probability.
Long distance low and medium frequency (below 2 MHz) propagation along east-west paths over high and upper middle latitudes is very poor. Propagation on long distance northeast-southwest paths is poor to fair. Trans Atlantic propagation conditions are normally monitored every night on 1470 kHz. Dominant stations tonight: Radio Cristal del Uruguay, LT28 Rafaela Argentina and Radio Vibraci�n (Venezuela). CJYQ on 930 kHz was noted as the only North American station.
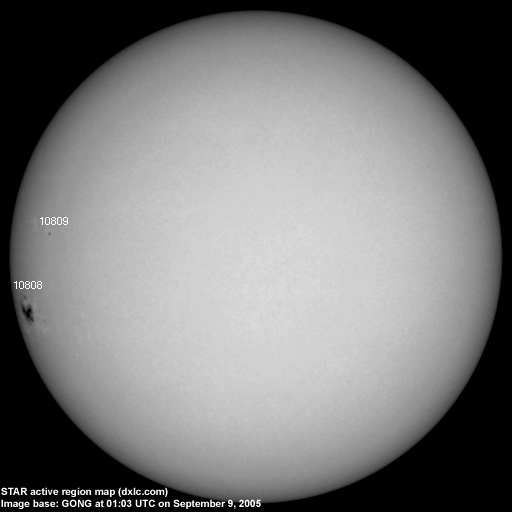
Compare to the previous day's image.
Data for all numbered solar regions according to the Solar Region Summary provided by NOAA/SEC. Comments are my own, as is the STAR spot count (spots observed at or inside a few hours before midnight) and data for regions not numbered by SEC or where SEC has observed no spots. SEC active region numbers in the table below and in the active region map above are the historic SEC/USAF numbers.
| Active region | Date numbered | SEC spot count |
STAR spot count |
Location at midnight | Area | Classification | Comment |
|---|---|---|---|---|---|---|---|
| 10805 | 2005.08.27 | S12W85 | |||||
| 10806 | 2005.08.29 | S16W84 | plage | ||||
| 10808 | 2005.09.07 | 14 | 19 | S09E67 | 0510 | EKC | beta-delta area was 1100 at midnight |
| 10809 | 2005.09.08 | 2 | 1 | N10E60 | 0040 | HSX | formerly region S590 |
| S588 | 2005.08.31 | N12W75 | plage | ||||
| Total spot count: | 16 | 20 | |||||
| SSN: | 36 | 40 | |||||
| Month | Average solar flux at Earth |
International sunspot number | Smoothed sunspot number |
|---|---|---|---|
| 2000.04 | 184.2 | 125.5 | 120.8 cycle 23 sunspot max. |
| 2000.07 | 202.3 | 170.1 | 119.8 |
| 2001.12 | 235.1 | 132.2 | 114.6 (-0.9) |
| 2004.07 | 119.1 | 51.1 | 40.2 (-1.4) |
| 2004.08 | 109.6 | 40.9 | 39.2 (-1.0) |
| 2004.09 | 103.1 | 27.7 | 37.5 (-1.7) |
| 2004.10 | 105.9 | 48.0 | 35.9 (-1.6) |
| 2004.11 | 113.2 | 43.5 | 35.3 (-0.6) |
| 2004.12 | 94.5 | 17.9 | 35.2 (-0.1) |
| 2005.01 | 102.2 | 31.3 | 34.6 (-0.6) |
| 2005.02 | 97.2 | 29.2 | 33.9 (-0.7) |
| 2005.03 | 89.9 | 24.5 | (33.5 predicted, -0.4) |
| 2005.04 | 86.0 | 24.4 | (32.2 predicted, -1.3) |
| 2005.05 | 99.3 | 42.6 | (29.9 predicted, -2.3) |
| 2005.06 | 93.7 | 39.6 | (28.7 predicted, -1.2) |
| 2005.07 | 96.4 | 39.9 | (27.7 predicted, -1.0) |
| 2005.08 | 90.5 | 36.4 | (25.8 predicted, -1.9) |
| 2005.09 | 81.2 (1) | 5.0 (2) | (24.2 predicted, -1.6) |
1) Running average based on the daily 20:00 UTC observed solar flux
value at 2800 MHz.
2) Unofficial, accumulated value based on the Boulder (NOAA/SEC)
sunspot number. The official international sunspot number is typically
30-50% lower.
This report has been prepared by Jan Alvestad. It is based partly on my own observations and analysis, and partly on data from some of these solar data sources. All time references are to the UTC day. Comments and suggestions are always welcome.
| [DX-Listeners' Club] |