
Last major update issued on August 18, 2006 at 03:05 UTC.
[Solar and
geomagnetic data - last month (updated daily)]
[Solar wind and
electron fluence charts (updated daily)]
[Solar cycles 21-23
(last update August 6, 2006)]
[Solar cycles 1-20]
[Graphical comparison
of cycles 21, 22 and 23 (last update August 6, 2006)]
[Graphical
comparison of cycles 2, 10, 13, 17, 20 and 23 (last update August 6, 2006)]
[Historical solar and
geomagnetic data charts 1954-2005 (last update March 3, 2006)]
[Archived reports (last update
August 6, 2006)]
The geomagnetic field was quiet on August 17. Solar wind speed ranged between 285 and 352 km/s (all day average 324 km/s - increasing 30 km/s over the previous day). A minor disturbance was in progress after 08h UTC.
Solar flux measured at 20h UTC on 2.8 GHz was 85.8. The planetary A index
was 5 (STAR Ap - based on the mean of three hour interval ap
indices: 4.9).
Three hour interval K indices: 10211122 (planetary), 01311112 (Boulder).
The background x-ray flux is at the class A7 level.
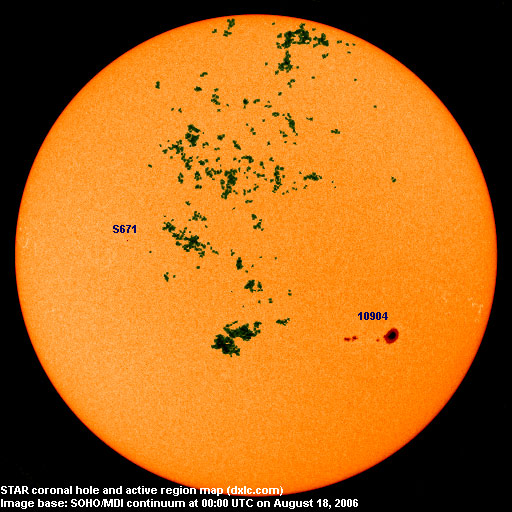
At midnight there were 2 spotted regions on the visible solar disk. The solar flare activity level was very low. No C class events were recorded during the day.
Region 10904 decayed slowly and remains capable of producing C flares and maybe an isolated M class flare.
Spotted regions not numbered by NOAA/SEC:
[S671] This region emerged in the northeast quadrant on August 17.
Location at midnight: N09E32.
August 15 and 17: No partly or fully Earth directed CMEs were detected in
LASCO imagery.
August 16: A large Earth directed CME was observed in LASCO images after
the LDE in region 10904 during the afternoon.
Coronal hole history (since late October 2002)
Compare today's report to the situation one solar rotation ago:
28 days ago
27 days ago
26 days ago
A small coronal hole in the southern hemisphere is probably located just too far to the south to be geoeffective, it rotates across the central meridian on August 18.

Processed SOHO/EIT 284 image at 19:06 UTC on August 18. The darkest areas on the solar disk are likely coronal holes.
The geomagnetic field is expected to be quiet to unsettled on August 18. A large CME could impact Earth sometime between late on August 18 and the early afternoon of August 19. Active to major or perhaps even severe storm conditions are possible for 12-30 hours after the arrival of the shock. Quiet to unsettled is likely on August 21-22.
| Coronal holes (1) | Coronal mass ejections (2) | M and X class flares (3) |
1) Effects from a coronal hole could reach Earth
within the next 5 days. When the high speed stream has arrived the color changes to green.
2) Effects from a CME are likely to be observed at Earth within 96 hours.
3) There is a possibility of either M or X class flares within the next 48 hours.
Green: 0-20% probability, Yellow: 20-60% probability, Red: 60-100% probability.
Long distance low and medium frequency (below 2 MHz) propagation along east-west paths over high and upper middle latitudes is poor to fair. From North America some stations from primarily the Newfoundland/Nova Scotia and New York / Boston areas were audible with fair signals. Propagation on long distance northeast-southwest paths is very poor.
Compare to the previous day's image.
Data for all numbered solar regions according to the Solar Region Summary provided by NOAA/SEC. Comments are my own, as is the STAR spot count (spots observed at or inside a few hours before midnight) and data for regions not numbered by SEC or where SEC has observed no spots. SEC active region numbers in the table below and in the active region map above are the historic SEC/USAF numbers.
| Active region | Date numbered | SEC spot count |
STAR spot count |
Location at midnight | Area | Classification | Comment |
|---|---|---|---|---|---|---|---|
| 10903 | 2006.08.07 | S08W65 | plage | ||||
| 10904 | 2006.08.09 | 16 | 14 | S13W28 | 0590 | FKO | |
| S671 | 2006.08.17 | 1 | N09E32 | 0010 | AXX | ||
| Total spot count: | 16 | 15 | |||||
| SSN: | 26 | 35 | |||||
| Month | Average solar flux at Earth |
International sunspot number | Smoothed sunspot number |
|---|---|---|---|
| 2000.04 | 184.2 | 125.5 | 120.8 cycle 23 sunspot max. |
| 2000.07 | 202.3 | 170.1 | 119.8 |
| 2001.12 | 235.1 | 132.2 | 114.6 (-0.9) |
| 2005.06 | 93.7 | 39.3 | 28.8 (-0.1) |
| 2005.07 | 96.4 | 40.1 | 29.1 (+0.3) |
| 2005.08 | 90.5 | 36.4 | 27.4 (-1.7) |
| 2005.09 | 91.1 | 21.9 | 25.8 (-1.6) |
| 2005.10 | 77.0 | 8.5 | 25.5 (-0.3) |
| 2005.11 | 86.3 | 18.0 | 24.9 (-0.6) |
| 2005.12 | 90.7 | 41.2 | 23.0 (-1.9) |
| 2006.01 | 83.4 | 15.4 | 20.8 (-2.2) |
| 2006.02 | 76.5 | 4.7 | (18.4 predicted, -2.4) |
| 2006.03 | 75.4 | 10.8 | (16.6 predicted, -1.8) |
| 2006.04 | 89.0 | 30.2 | (15.9 predicted, -0.7) |
| 2006.05 | 80.9 | 22.2 | (15.1 predicted, -0.8) |
| 2006.06 | 76.5 | 13.9 | (12.9 predicted, -2.2) |
| 2006.07 | 75.7 | 12.2 | (11.4 predicted, -1.5) |
| 2006.08 | 78.0 (1) | 11.4 (2) | (11.4 predicted, -0.0) |
1) Running average based on the
daily 20:00 UTC observed solar flux
value at 2800 MHz.
2) Unofficial, accumulated value based on the Boulder (NOAA/SEC)
sunspot number. The official international sunspot number is typically
30-50% lower.
This report has been prepared by Jan Alvestad. It is based partly on my own observations and analysis, and partly on data from some of these solar data sources. All time references are to the UTC day. Comments and suggestions are always welcome.
| [DX-Listeners' Club] |