Last major update issued on March 10, 2011 at 05:50 UTC. Minor update posted at 18:55 UTC.
[Solar and geomagnetic data - last month (updated
daily)]
[Solar wind and electron fluence charts (updated
daily)
[Solar cycles 21-24 (last update March 2, 2011)]
[Solar cycles 1-20]
[Graphical comparison of cycles 21, 22, 23 and 24 (last
update March 2, 2011)]
[Graphical comparison of cycles 10, 12, 13, 14, 16 and
24 (last update March 2, 2011)]
[Historical solar and geomagnetic data charts 1954-2006
(last update April 5, 2007)]
[Archived reports since January 2003 (last update March
1, 2011)]
[POES auroral activity level charts since October
2009 - updated March 8, 2011]
Annotated geomagnetic activity charts - Carrington rotation 2105 [Dec-Jan.2011] - 2106 [Jan.-Feb.2011]
NEW
The geomagnetic field was quiet on March 9.
Solar flux measured at 20h UTC on 2.8 GHz was 143.1 (increasing 51.7 over the last solar rotation). The planetary A index was 4 (STAR Ap - based on the mean of three hour interval ap indices: 4.5). Three hour interval K indices: 21111122 (planetary), 21111122 (Boulder).
The background x-ray flux is at the class C1 level.
At midnight UTC the visible solar disk had 7 spotted regions.
Region 11164 was mostly quiet and is rotating out of view at the
northwest limb. Flare: C5.6 at 01:59
UTC.
Region 11166 developed further with a significant magnetic delta
structure forming in the large central penumbra. There's a minor delta
structure in the southeastermost penumbra as well. Further major flares are
likely as long as the magnetic delta in the central penumbra persists. Flares: C9.4 at 08:55, M1.7 at 14:02, C9.4 at
22:12 and a major, impulsive X1.5 at 23:23 UTC.
Region 11167 reemerged with small spots.
Region 11169 developed slowly and could produce further C flares. Flare: C2.7 at 16:48 and C5.0 at 21:10 UTC.
Region 11170 decayed slowly and will be rotating out of view at the
southwest limb today. Flare: C2.6 at 15:48
UTC.
Region 11171 was quiet and stable.
Region S891 produced a C4.7 flare at 02:21, a C6.4 flare at 02:33 and an M1.7 flare from behind the southwest limb at 11:07 UTC (the latter flare has been attibuted to 11166 by SWPC, while the 2 C flares were wrongly attributed to region 11171).
Spotted regions not numbered by NOAA/SWPC:
[S900] Tiny spots emerged in an old plage area in the southeastern
quadrant on March 8. Location at midnight: S19E16.
Minor update posted at 07:05 UTC on March 10: A solar wind shock was observed at ACE near 06:10 UTC, the arrival of the CME observed on March 7. The interplanetary magnetic field is only moderately strong, but as it is initially nearly fully southwards minor geomagnetic storming is likely.
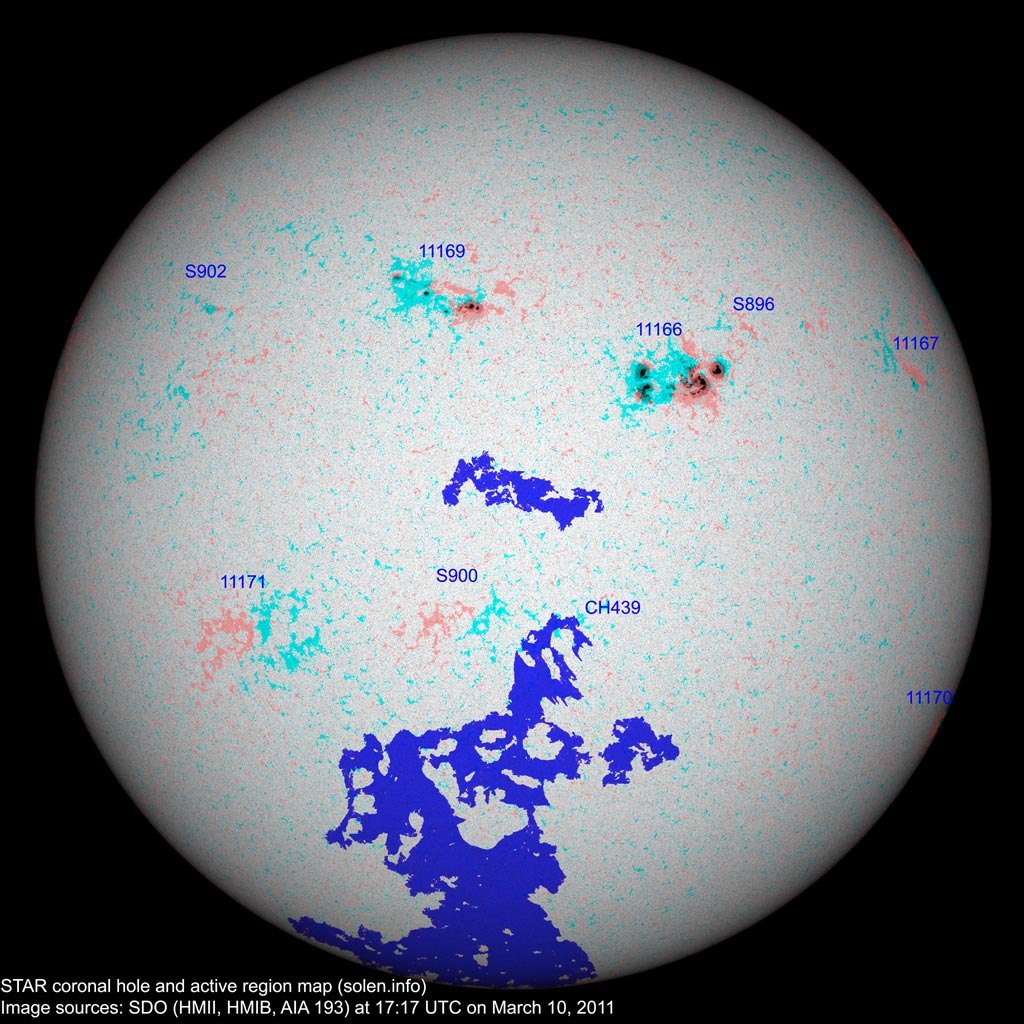
Minor update add at 18:55 on March 10: With region 11164 rotating out of view the background xray flux has decreased to the B7 level. Region 11169 has decayed somewhat while region S896 reemerged with a single spot and new region S902 emerged in the northeast quadrant. The latest coronal hole and active region map.
March 8-9: No obviously Earth directed CMEs were observed in LASCO
and STEREO imagery.
March 7: A very fast CME was produced by the M3.7 LDE in region 11164
late in the day. Due to the origin of the CME near the northwest limb, it is
likely that we will only see a flank impact on sometime on March 10.
Coronal hole history (since late October
2002)
Compare today's report to the situation one solar rotation ago: 28 days ago
27 days
ago 26
days ago
An extension (CH439) of the southern polar coronal hole will be Earth facing on March 10.
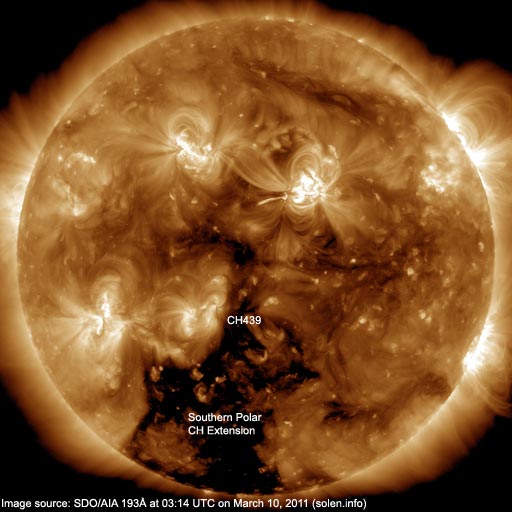
The darkest areas on the solar disk are likely coronal holes.
Long distance low and medium frequency (below 2 MHz) propagation along paths north of due west over high and upper middle latitudes is poor. Propagation on long distance northeast-southwest paths is poor.
The geomagnetic field is expected to be quiet to minor storm on March 10 and quiet to unsettled on March 11 due to CME effects. Mostly quiet conditions are likely on March 12.
| Coronal holes (1) | Coronal mass ejections (2) | M and X class flares (3) |
1) Effects from a coronal hole could reach Earth within the
next 5 days. When the high speed stream has arrived the color changes to
green.
2) Effects from a CME are likely to be observed at Earth within 96 hours.
3) There is a possibility of either M or X class flares within the next 48
hours.
Green: 0-20% probability, Yellow: 20-60% probability, Red: 60-100% probability.
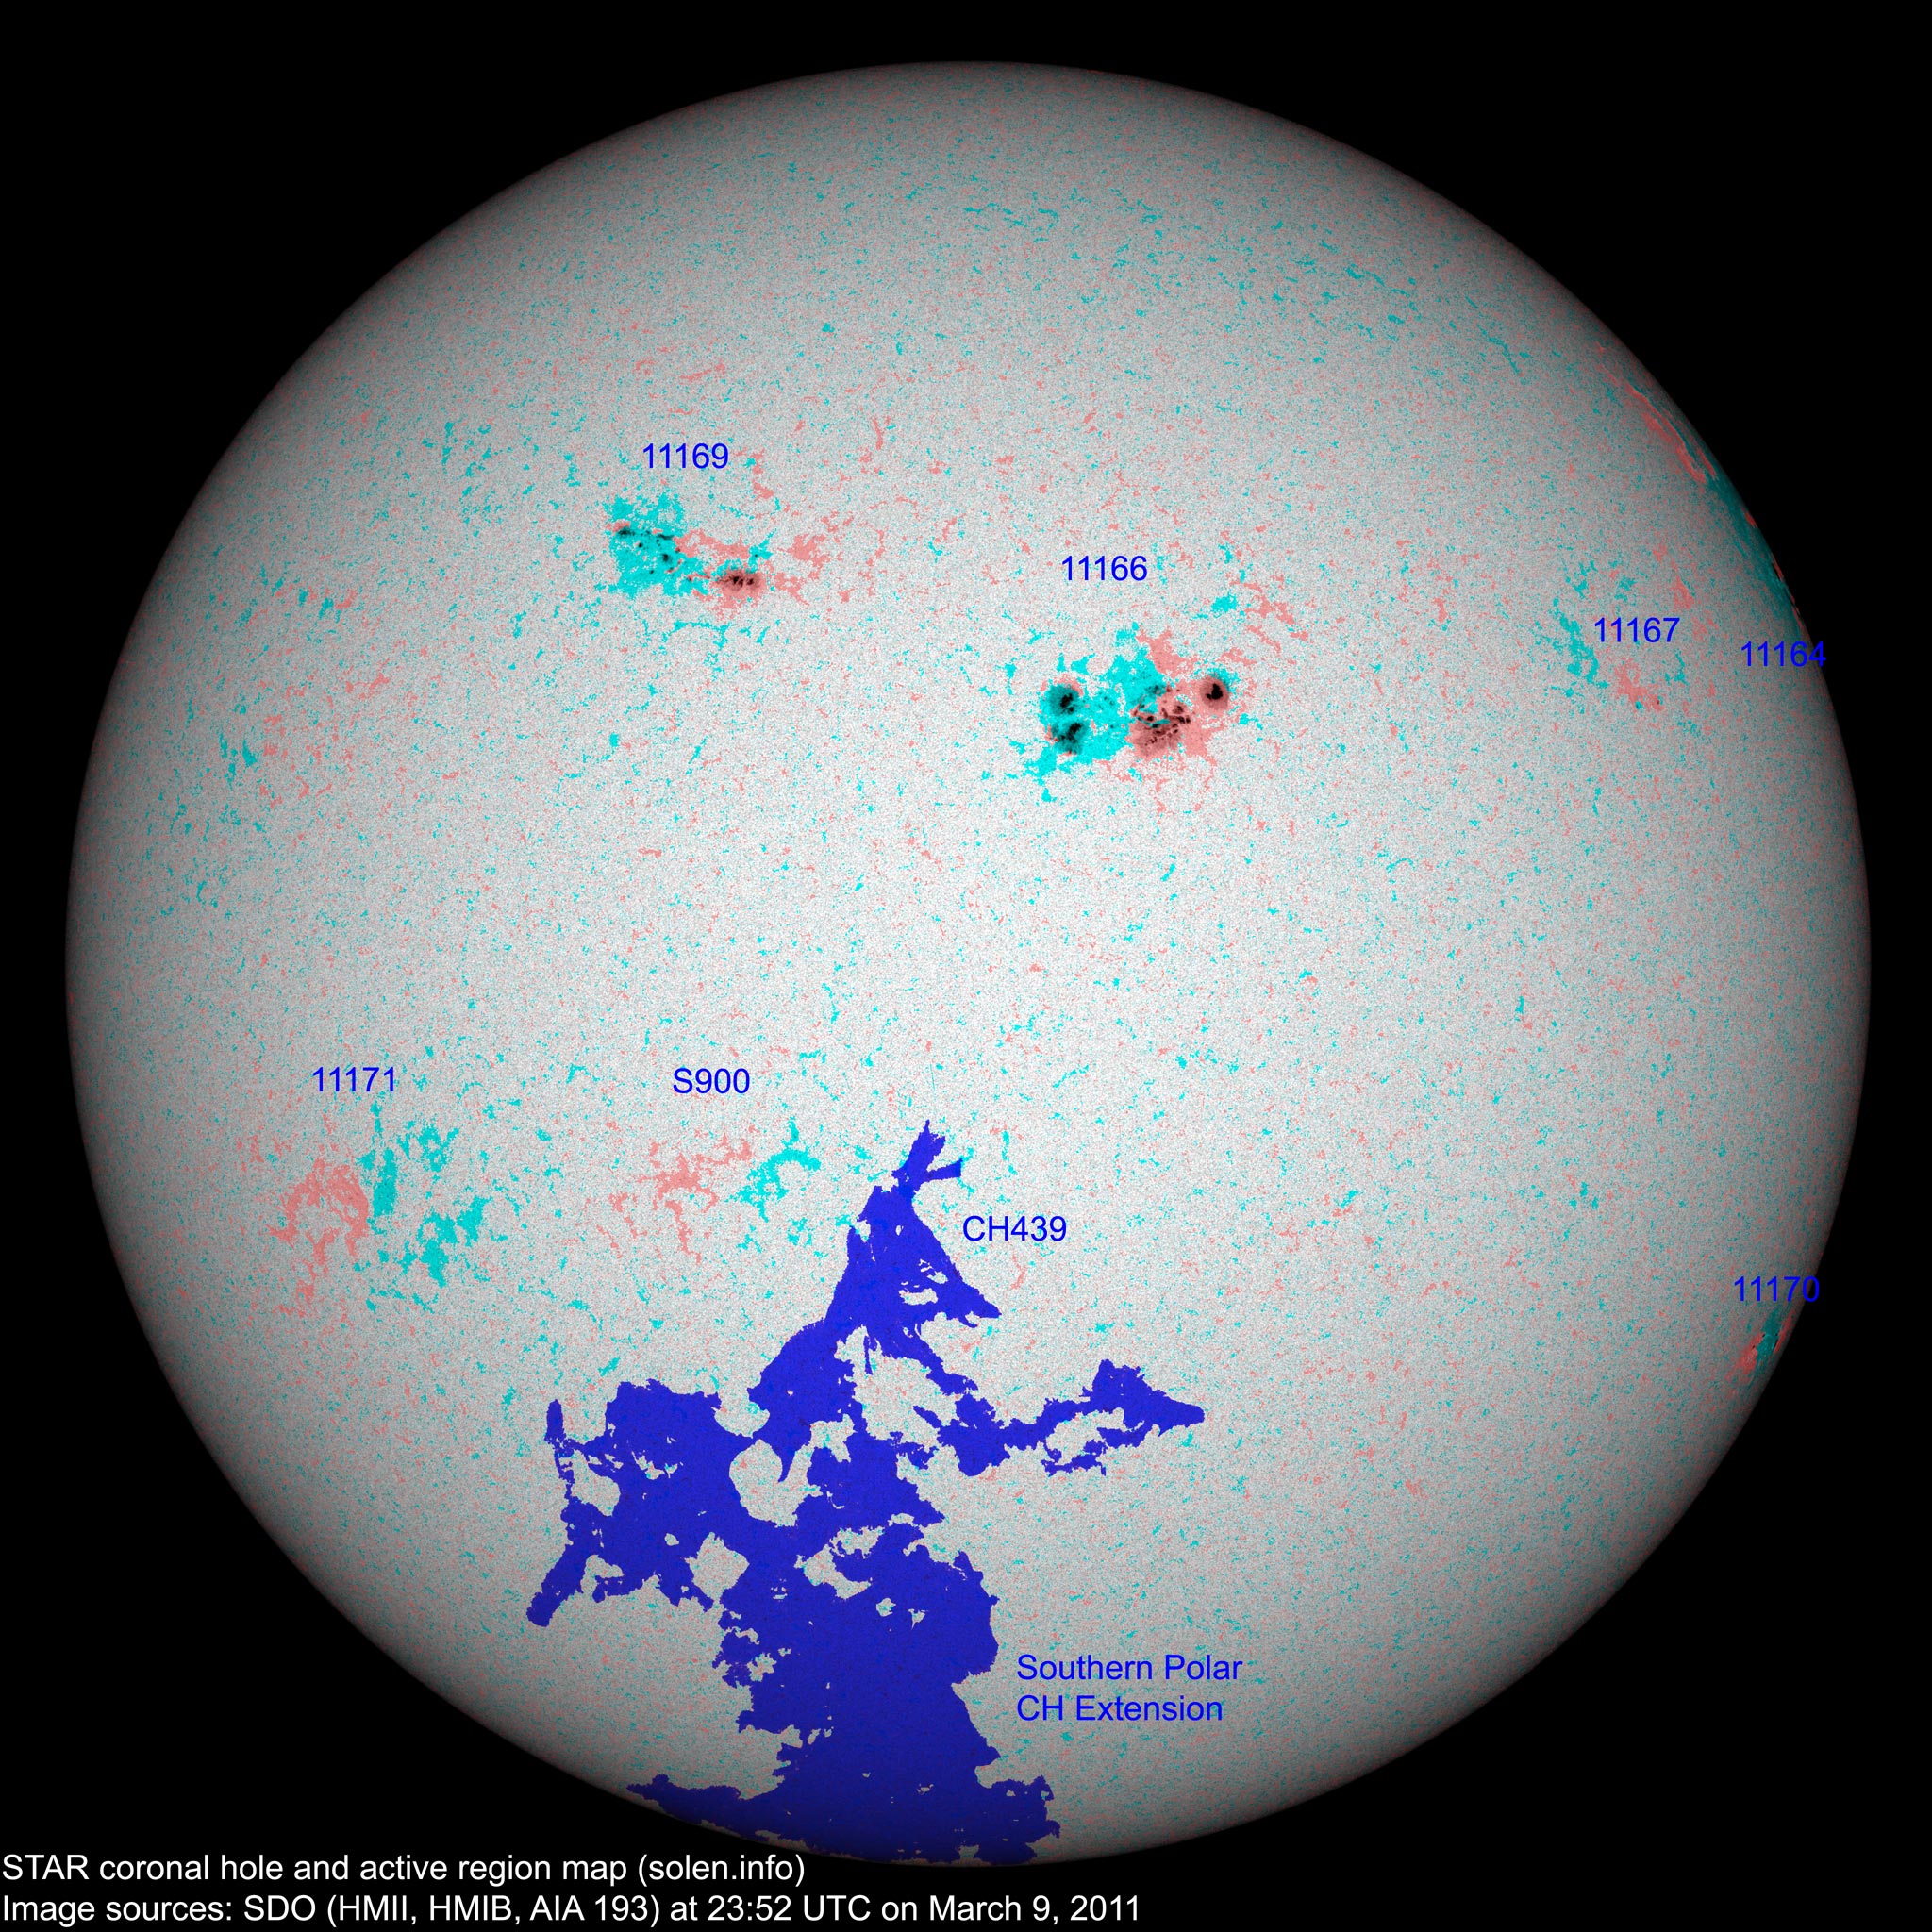
(Click on image for higher resolution image) Compare to the previous day's image
When available the active region map has a coronal hole polarity overlay where red (pink) is negative and blue (blue-green) is positive.
Data for all numbered solar regions according to the Solar Region Summary provided by NOAA/SWPC. Comments are my own, as is the STAR spot count (spots observed at or inside a few hours before midnight) and data for regions not numbered by SWPC or where SWPC has observed no spots. SWPC active region numbers in the table below and in the active region map above are the historic SWPC/USAF numbers.
| Active region | Date numbered detected |
Spot count | Location at midnight | Area | Classification | SDO / HMI 4K continuum image with polarity overlay |
Comment | |||
|---|---|---|---|---|---|---|---|---|---|---|
| SWPC | STAR SDO | SWPC | STAR | Current | Previous | |||||
| 11164 | 2011.02.25 | 9 | 5 | N23W84 | 0350 | DAI | DAC |  |
 |
|
| 11166 | 2011.03.02 | 55 | 49 | N09W12 | 0630 | EKC | EKC |  |
 |
beta-gamma-delta |
| 11167 | 2011.03.02 2011.03.03 |
2 | N13W50 | 0010 | BXO |  |
|
|||
| S893 | 2011.03.03 | N20W56 | plage | |||||||
| 11169 | 2011.03.05 2011.03.06 |
22 | 31 | N20E18 | 0220 | ESC | ESI |  |
 |
beta-gamma |
| S895 | 2011.03.05 | N07W40 | plage | |||||||
| S896 | 2011.03.06 | N16W20 |  |
plage | ||||||
| 11170 | 2011.03.07 2011.03.08 |
6 | 6 | S26W79 | 0050 | BXO | BXO |  |
 |
area: 0020 |
| S898 | 2011.03.07 | S13E11 | plage | |||||||
| S899 | 2011.03.07 | N19W30 | plage | |||||||
| 11171 | 2011.03.08 | 4 | S19E55 | 0000 | BXO |  |
 |
location of spots: S19E44 | ||
| S900 | 2011.03.08 | 3 | S19E16 | 0000 | BXO |  |
 |
|||
| S901 | 2011.03.08 | S22W27 |  |
plage | ||||||
| Total spot count: | 92 | 100 | ||||||||
| Sunspot number: | 132 | 170 | ||||||||
| Month | Average measured solar flux | International sunspot number (SIDC) | Smoothed sunspot number | Average ap (3) |
|---|---|---|---|---|
| 2008.07 | 65.7 (SF minimum) | 0.5 | 2.8 (-0.4) | |
| 2008.12 | 69.2 | 0.8 | 1.7 (-) sunspot minimum |
3.25 |
| 2009.12 | 76.7 | 10.8 | 8.3 (+0.7) | 1.41 / 1.92 |
| 2010.01 | 81.1 | 13.2 | 9.3 (+1.0) | 2.93 / 3.07 |
| 2010.02 | 84.7 | 18.8 | 10.6 (+1.3) | 4.15 / 4.61 |
| 2010.03 | 83.4 | 15.4 | 12.3 (+1.7) | 4.58 / 4.65 |
| 2010.04 | 75.9 | 8.0 | 14.0 (+1.7) | 10.22 / 10.24 |
| 2010.05 | 73.8 | 8.7 | 15.5 (+1.5) | 9.18 / 8.15 |
| 2010.06 | 72.5 | 13.6 | 16.4 (+0.9) | 8.17 / 6.85 |
| 2010.07 | 79.8 | 16.1 | 16.8 (+0.4) | 6.31 / 5.15 |
| 2010.08 | 79.2 | 19.6 | 17.4 (+0.6) | 8.49 / 7.77 |
| 2010.09 | 81.1 | 25.2 | (19.1 predicted, +1.7) | 5.33 / 5.45 |
| 2010.10 | 81.6 | 23.5 | (21.7 predicted, +2.6) | 6.07 / 6.27 |
| 2010.11 | 82.5 | 21.6 | (24.5 predicted, +2.8) | 4.80 / 5.50 |
| 2010.12 | 84.2 | 14.5 | (26.9 predicted, +2.4) | 3.41 / 4.35 |
| 2011.01 | 83.6 | 19.1 | (29.0 predicted, +2.1) | 4.32 |
| 2011.02 | 94.6 | 29.4 | (31.1 predicted, +2.1) | 5.41 |
| 2011.03 | 132.6 (1) | 30.7 (2A) / 105.9 (2B) | (33.0 predicted, +1.9) | (11.07) |
1) Running average based on the daily 20:00 UTC observed solar flux value at
2800 MHz.
2A) Current impact on the monthly sunspot number based on the Boulder
(NOAA/SWPC) sunspot number (accumulated daily sunspots / month days). The
official SIDC international sunspot number is typically 30-50% lower. 2B) Month
average to date.
3) Running average based on the preliminary daily SWPC ap indices.
Values in red are based on the official NGDC
ap indices.
This report has been prepared by Jan Alvestad. It is based on analysis of data from whatever sources are available at the time the report is prepared. All time references are to the UTC day. Comments and suggestions are always welcome.
SDO images are courtesy of NASA/SDO and the AIA, EVE, and HMI science teams.