Last major update issued on November 2, 2011 at 04:40 UTC. Minor update posted at 19:35 UTC.
[Solar and geomagnetic data - last month (updated
daily)]
[Solar wind and electron fluence charts (updated
daily)
[Solar cycles 21-24 (last update
November 1, 2011)]
[Solar cycles 1-20]
[Graphical comparison of cycles 21, 22, 23 and 24 (last
update November 1, 2011)]
[Graphical comparison of cycles 10, 12, 13, 14, 16 and
24 (last update November 1, 2011)]
[Historical solar and geomagnetic data charts 1954-2006
(last update April 5, 2007)]
[Archived reports since January 2003 (last update
November 2, 2011)]
[POES auroral activity level since October
2009 - updated November 2, 2011]
Annotated geomagnetic activity charts - Carrington rotation
2114 [August-September 2011] -
2115 [September-October 2011] NEW
[Solar polar fields vs solar cycles - updated
June 27, 2011]
The geomagnetic field was quiet to minor storm on November 1. Solar wind speed ranged between 345 and 476 km/s. A solar wind shock was observed at 08:20 UTC at SOHO.The likely source was a CME observed early on October 29 following a filament eruption which began late on Oct.28 near the center of the visible disk.
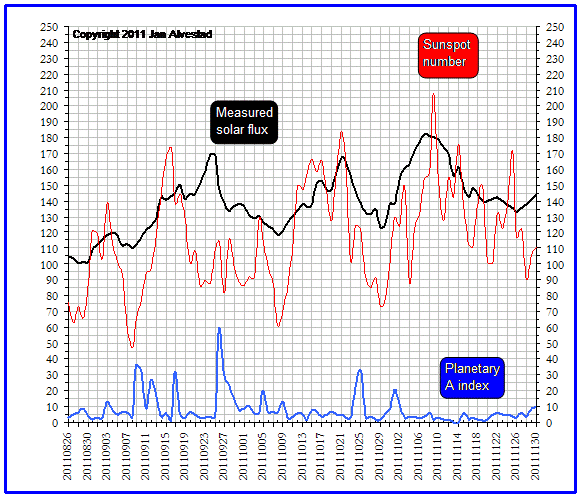
Solar flux measured at 20h UTC on 2.8 GHz was 138.6 (increasing 11.9 over the last solar rotation). The planetary A index was 21 (STAR Ap - based on the mean of three hour interval ap indices: 21.3). Three hour interval K indices: 42454332 (planetary), 42453322 (Boulder).
The background x-ray flux is at the class C1 level.
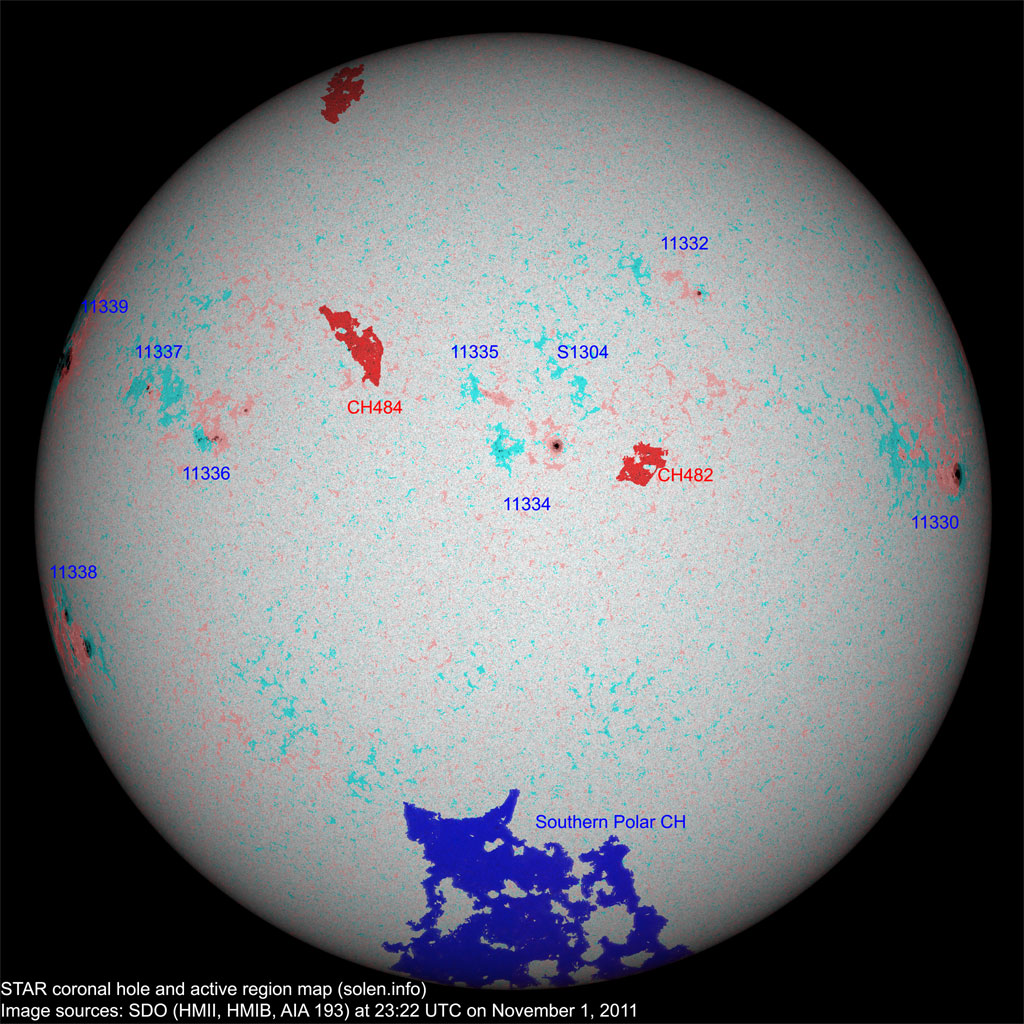
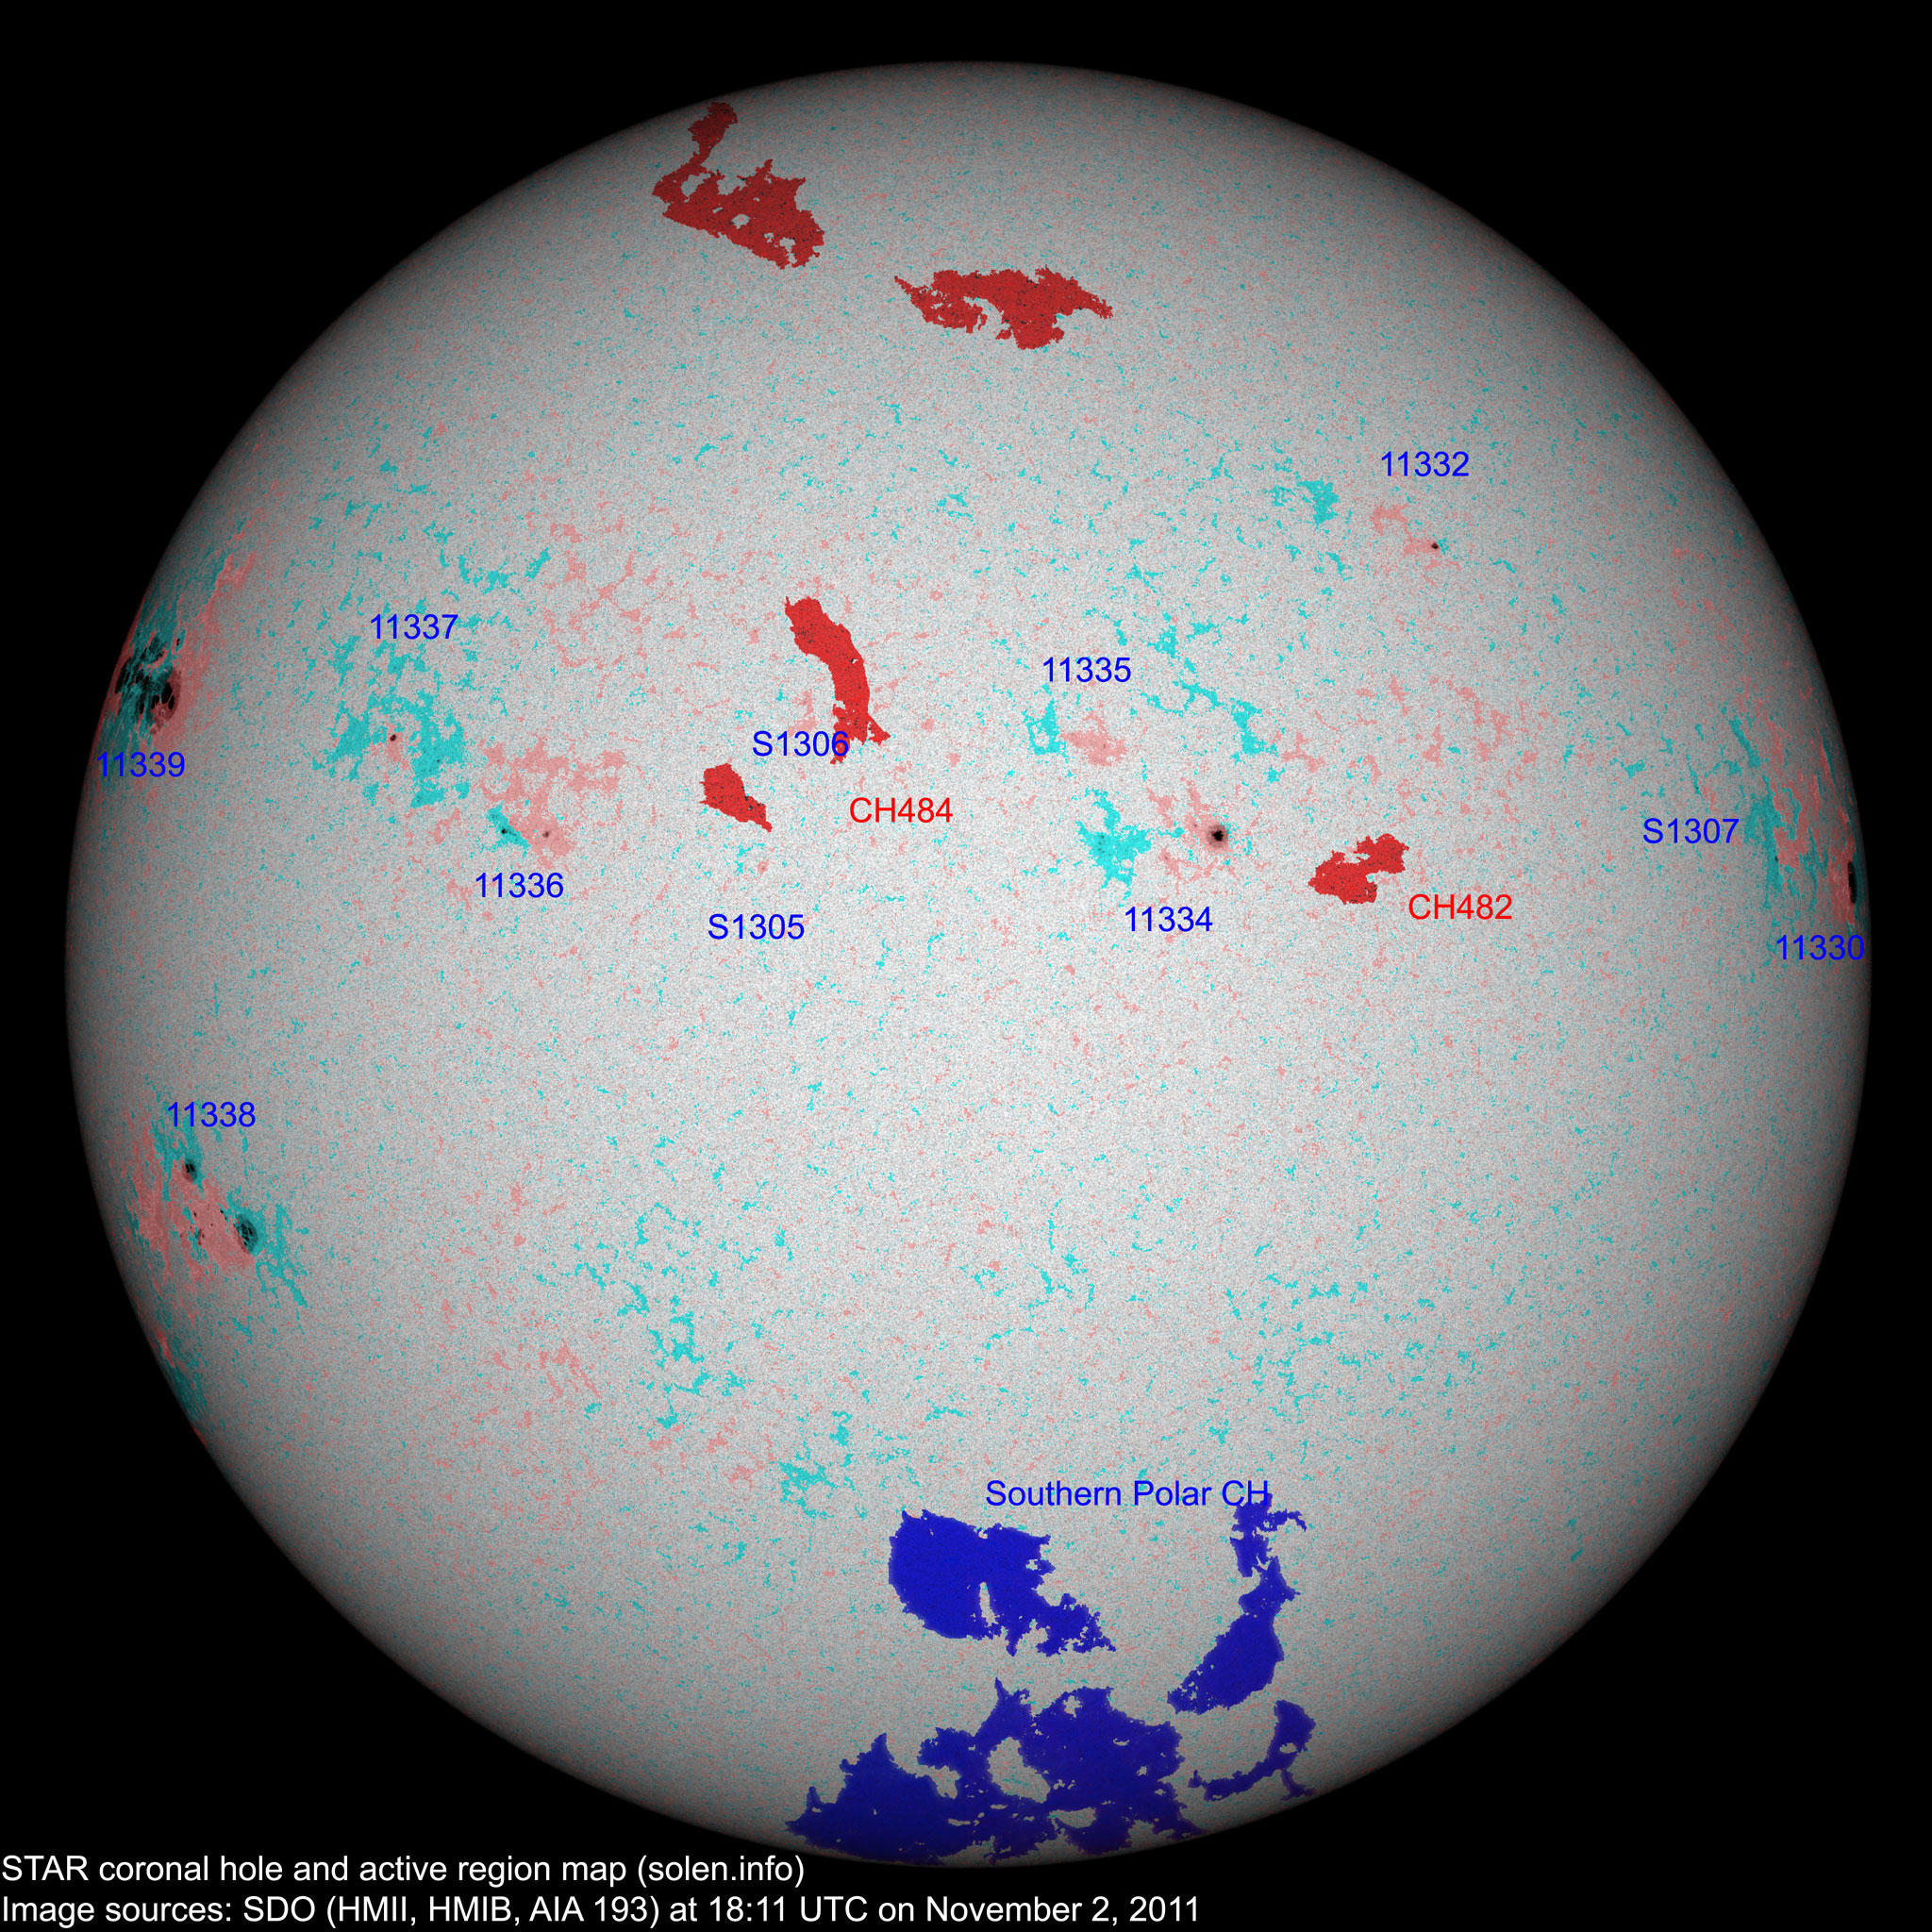
At midnight UTC the visible solar disk had 9 spotted regions (in 2K resolution SDO images).
Region 11330 [N06W68] decayed further losing most of the trailing
spots.
Region 11332 [N32W26] was quiet and stable.
Region 11334 [N13W04] decayed slowly and quietly.
Region 11335 [N18E03] decayed slowly and quietly.
Region 11336 [N13E40] developed quickly early in the day, then decayed
significantly during the latter half of the day.
Region 11337 [N17E53] was quiet and gained a few spots
New region 11338 [S13E70] rotated into view at the southeast limb on
October 31 and was numbered the next day by SWPC. Flare:
C4.3 at 10:32 UTC
New region 11339 [N19E83] rotated partly into view at the northeast limb
revealing a compact region with large penumbrae. M flares are likely and there's
a chance of an X flare as well. Flares: C1.9
at 06:29, C4.1 at 18:26, C2.7 at 20:08, C4.7 at 21:52 UTC
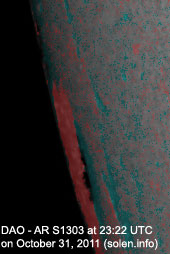
Spotted regions not reported by NOAA/SWPC:
[S1304] emerged in the northeast quadrant on October 31. Location at
midnight: N19W08
Minor update added at 19:35 UTC on November 2, 2011: Region 11339 has rotated fully into view revealing what is easily the largest area of any region during cycle 24. This FKC region spans about 17 degrees longitudinally with nearly continuous penumbral coverage (more than 2000 mills). There is a significant magnetic delta structure in the central southern part of the region and apparently a few smaller deltas elsewhere in the region. This region has the potential to release very large flares (class X10+). The latest high resolution CHARMAP.
October 30 - November 1: No obviously Earth directed CMEs observed.
Coronal hole history (since late October
2002)
Compare today's report to the situation one solar rotation ago:
28 days ago
27 days ago
26 days ago
A small coronal hole (CH482) in the northern hemisphere was in an Earth facing position on October 31-November 1. A small coronal hole (CH484) in the northern hemisphere will likely rotate into an Earth facing position on November 3.
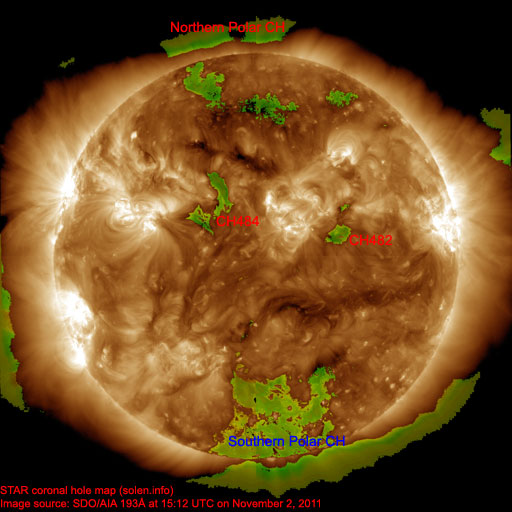
The above coronal hole map is based on a new method where coronal holes are detected automatically. The method may need some fine tuning, however, it has significant advantages over detecting coronal holes manually. The main improvement is the ability to detect coronal holes at and just beyond the solar limbs. Early results using this method for SDO images over a span of several weeks indicate a good match between coronal holes observed over the visible disk and their extent and position at the east and west limbs. Note that the polar coronal holes are easily detected using the new method, the extent and intensity of both holes are consistent with other data sources.
Long distance low and medium frequency (below 2 MHz) propagation along paths north of due west over high and upper middle latitudes is poor. Propagation on long distance northeast-southwest paths is fair to good.
The geomagnetic field is expected to be quiet to unsettled on November 2-4, the last two days due to weak coronal hole effects.
| Coronal holes (1) | Coronal mass ejections (2) | M and X class flares (3) |
1) Effects from a coronal hole could reach Earth within the
next 5 days. When the high speed stream has arrived the color changes to
green.
2) Effects from a CME are likely to be observed at Earth within 96 hours.
3) There is a possibility of either M or X class flares within the next 48
hours.
Green: 0-20% probability, Yellow: 20-60% probability, Red: 60-100% probability.
 (Click on image for higher resolution image)
Compare to the
previous day's image
(Click on image for higher resolution image)
Compare to the
previous day's image
When available the active region map has a coronal hole polarity overlay where red (pink) is negative and blue (blue-green) is positive.
Data for all numbered solar regions according to the Solar Region Summary provided by NOAA/SWPC. Comments are my own, as is the STAR spot count (spots observed at or inside a few hours before midnight) and data for regions not numbered by SWPC or where SWPC has observed no spots. SWPC active region numbers in the table below and in the active region map above are the historic SWPC/USAF numbers.
| Active region | Date numbered detected |
Spot count | Location at midnight | Area | Classification | SDO / HMI 4K continuum image with polarity overlay |
Comment | |||
|---|---|---|---|---|---|---|---|---|---|---|
| SWPC | STAR SDO | SWPC | STAR | Current | Previous | |||||
| 11330 | 2011.10.21 2011.10.22 |
7 | 8 | N06W65 | 0350 | DKO | CHO |
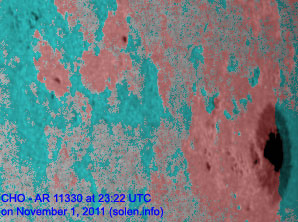 |
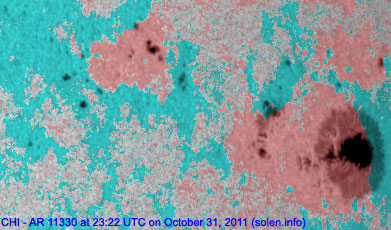 |
location: N06W68 |
| 11333 | 2011.10.23 2011.10.27 |
7 | N09W59 | 0010 | AXX |
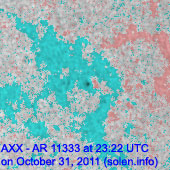 |
spotless location: N16W54 SWPC has moved the region southwards to include the trailing spots of 11330 |
|||
| 11332 | 2011.10.23 2011.10.24 |
1 | 3 | N31W27 | 0010 | AXX | HRX |
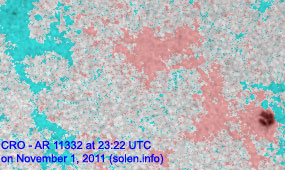 |
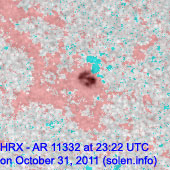 |
location: N32W26 |
| S1296 | 2011.10.27 | N17W29 | plage | |||||||
| 11335 | 2011.10.28 2011.10.31 |
3 | 7 | N18E02 | 0010 | BXO | BXO |
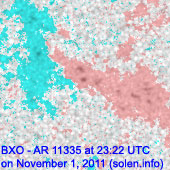 |
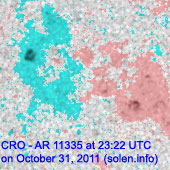 |
|
| S1299 | 2011.10.28 | N16W36 | plage | |||||||
| 11336 | 2011.10.29 2011.10.31 |
6 | 14 | N13E39 | 0040 | CSO | DRI |
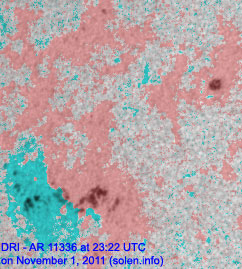 |
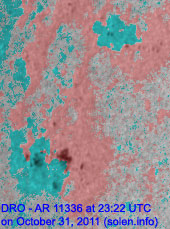 |
|
| 11334 | 2011.10.29 2011.10.30 |
9 | 12 | N12W03 | 0120 | DSO | CSO |
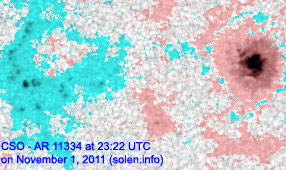 |
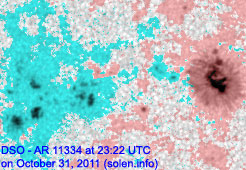 |
|
| 11337 | 2011.10.30 2011.10.31 |
2 | 9 | N17E51 | 0010 | BXO | CRO |
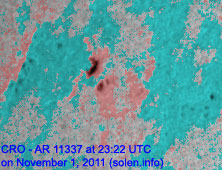 |
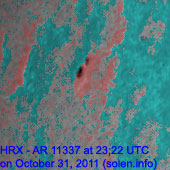 |
|
| 11338 | 2011.10.31 2011.11.01 |
2 | 13 | S12E69 | 0120 | DAO | DSO |
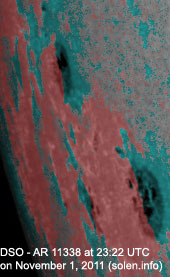 |
 |
location: S13E70 area: 0240 |
| S1304 | 2011.10.31 | 1 | N19W08 | 0000 | AXX |
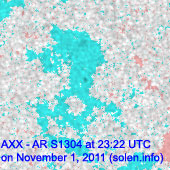 |
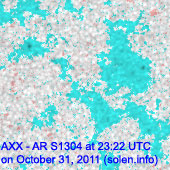 |
|||
| 11339 | 2011.11.01 | 2 | 11 | N22E71 | 0180 | DAO | EKC |
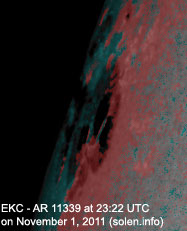 |
area: 0800 location: N19E83 |
|
| Total spot count: | 39 | 78 | ||||||||
| Sunspot number: | 129 | 168 | (total spot count + 10 * number of spotted regions) | |||||||
| Classification adjusted SN: | 69 | 117 | (Sum of total spot count + classification adjustment for each AR. Classification adjustment: X=0, R=3, A/S=5, H/K=10) | |||||||
| Relative sunspot number (Wolf number): | 77 | 76 | k * (sunspot number). k = 0.6 for SWPC. k = 0.45 (changed from 0.33 on Nov.1) for STAR SDO | |||||||
| Month | Average measured solar flux | International sunspot number (SIDC) | Smoothed sunspot number | Average ap (3) |
|---|---|---|---|---|
| 2008.07 | 65.7 (SF minimum) | 0.5 | 2.8 (-0.4) | |
| 2008.12 | 69.2 | 0.8 | 1.7 (-) sunspot minimum |
3.25 |
| 2010.07 | 79.8 | 16.1 | 16.7 (+0.3) | 6.31 / 5.15 |
| 2010.08 | 79.2 | 19.6 | 17.4 (+0.7) | 8.49 / 7.77 |
| 2010.09 | 81.1 | 25.2 | 19.6 (+2.2) | 5.33 / 5.45 |
| 2010.10 | 81.6 | 23.5 | 23.2 (+3.6) | 6.07 / 6.27 |
| 2010.11 | 82.5 | 21.5 | 26.5 (+3.3) | 4.80 / 5.50 |
| 2010.12 | 84.2 | 14.4 | 28.8 (+2.3) | 3.41 / 4.35 |
| 2011.01 | 83.6 | 19.1 | 31.0 (+2.2) | 4.32 / 5.51 |
| 2011.02 | 94.6 | 29.4 | 33.4 (+2.4) | 5.41 / 6.44 |
| 2011.03 | 115.0 | 56.2 | 36.9 (+3.5) | 7.79 / 8.18 |
| 2011.04 | 112.6 | 54.4 | 41.8 (+4.9) | 9.71 / 8.83 |
| 2011.05 | 95.8 | 41.6 | (47.4 predicted, +5.6) | 9.18 / 8.94 |
| 2011.06 | 95.8 | 37.0 | (52.5 predicted, +5.1) | 8.96 / 8.06 |
| 2011.07 | 94.2 | 43.9 | (58.2 predicted, +5.7) | 9.14 / 8.16 |
| 2011.08 | 101.7 | 50.6 | (63.7 predicted, +5.5) | 8.16 / 7.26 |
| 2011.09 | 133.8 | 78.0 | (67.0 predicted, +3.3) | 12.80 / 12.27 |
| 2011.10 | 137.3 | 88.0 | (70.5 predicted, +3.5) | 7.52 |
| 2011.11 | 138.6 (1) | 4.3 (2A) / 129.0 (2B) | (74.9 predicted, +4.4) | (21.25) |
1) Running average based on the daily 20:00 UTC observed solar flux value at
2800 MHz.
2A) Current impact on the monthly sunspot number based on the Boulder
(NOAA/SWPC) sunspot number (accumulated daily sunspots / month days). The
official SIDC international sunspot number is typically 30-50% lower. 2B) Month
average to date.
3) Running average based on the preliminary daily SWPC ap indices.
Values in red are based on the official NGDC
ap indices.
This report has been prepared by Jan Alvestad. It is based on analysis of data from whatever sources are available at the time the report is prepared. All time references are to the UTC day. Comments and suggestions are always welcome.
SDO images are courtesy of NASA/SDO and the AIA, EVE, and HMI science teams.