
Last major update issued on September 11, 2011 at 06:05 UTC. Minor update posted at 15:45 UTC
[Solar and geomagnetic data - last month (updated
daily)]
[Solar wind and electron fluence charts (updated
daily)
[Solar cycles 21-24 (last update
September 1, 2011)]
[Solar cycles 1-20]
[Graphical comparison of cycles 21, 22, 23 and 24 (last
update September 1, 2011)]
[Graphical comparison of cycles 10, 12, 13, 14, 16 and
24 (last update September 1, 2011)]
[Historical solar and geomagnetic data charts 1954-2006
(last update April 5, 2007)]
[Archived reports since January 2003 (last update
September 1, 2011)]
[POES auroral activity level since October
2009 - updated September 8, 2011]
Annotated geomagnetic activity charts - Carrington rotation
2112 [July
2011] -
2113 [July-August
2011] NEW
[Solar polar fields vs solar cycles - updated
June 27, 2011]
The geomagnetic field was unsettled to minor storm on September 10. Solar wind speed ranged between 433 and 530 km/s. The CME observed after the X1.8 flare on September 7 arrived at 14:43 UTC at SOHO. The effects of this CME lasted until just after 22h UTC when a high speed stream from CH475 became the dominant solar wind source.
Solar flux measured at 20h UTC on 2.8 GHz was 116.2 (increasing 28.1 over the last solar rotation). The planetary A index was 33 (STAR Ap - based on the mean of three hour interval ap indices: 33.4). Three hour interval K indices: 55443435 (planetary), 55443535 (Boulder).
The background x-ray flux is at the class B4 level.
At midnight UTC the visible solar disk had 7 spotted regions (in 2K resolution SDO images).
Region 11283 continued to decay slowly with a decrease in flare
intensity. There's a slight chance of an additional minor M class flare as the
region rotates around the northwest limb. Flare:
M1.1 at 07:40 UTC
Region 11287 was quiet and stable.
Region 11289 developed a weak magnetic delta structure in the
southernmost penumbra. C flares are likely and there's a chance of an M class
flare. There's also a tiny opposite polarity spot within the southwestern part
of the largest penumbra. Flare: C1.7 at
17:26 UTC
Region 11290 became more complex due to polarity intermixing. Several
small spots emerged. C flares are possible.
New region 11291 emerged in the northeast quadrant on September 9 and was
numbered the next day by SWPC.
Spotted regions not numbered by NOAA/SWPC:
[S1201] emerged in the southeast quadrant on September 10. Location at midnight:
S16E54
[S1202] emerged in the northern hemisphere near the central meridian on
September 10. Location at midnight: N11W03
A large filament eruption was observed beginning at 00:59 UTC in the central northern hemisphere and caused at least a partial halo CME. This CME could produce a weak impact with Earth's magnetosphere on September 13.
A filament eruption was observed beginning at 06:57 just southwest of region 11289. I'm not yet certain this was the source of a CME observed beginning in the left part of STEREO-A images at 09:24 and a little later in the right part of STEREO-B. No other significant activity was observed at the time. Unfortunately LASCO images covered only a small part of the hours after this eruption, a CME was observed beginning over the southwest limb which could point to another origin than the filament eruption. Based on STEREO data this CME could become geoeffective.
A very active region is approaching the northeast limb and should rotate into view within a couple of days.
Early on September 11 two new spotted regions are visible near the northeast limb.
Minor update added at 15:45 UTC on September 11: Lots of new regions have emerged in the northern hemisphere today. The regions near the northeast limb have begun rotating into view. The latest high resolution CHARMAP.
September 8: Another day with several CMEs observed. None appears to be
Earthbound as most of the activity was backsided.
September 9: No obviously Earth directed CMEs were observed. There was a
CME after the M2 event in region 11283 but its path makes any terrestrial
effects unlikely. Several backsided CMEs were noted.
September 10: A large filament eruption in the northwest quadrant early
in the day was associated with at least a partial halo CME. A filament eruption
starting at 07h UTC to the south of region 11289 may have been associated with a
potentially Earth directed CME.
Coronal hole history (since late October
2002)
Compare today's report to the situation one solar rotation ago:
28 days ago
27 days ago
26 days ago
A recurrent trans equatorial coronal hole (CH475) was in an Earth facing position on September 8-10. Another and smaller trans equatorial coronal hole (CH476) will rotate into an Earth facing position on September 11. CH476 decayed quickly on September 10 and could close on September 11.

The above coronal hole map is based on a new method where coronal holes are detected automatically. The method may need some fine tuning, however, it has significant advantages over detecting coronal holes manually. The main improvement is the ability to detect coronal holes at and just beyond the solar limbs. Early results using this method for SDO images over a span of several weeks indicate a good match between coronal holes observed over the visible disk and their extent and position at the east and west limbs. Note that the polar coronal holes are easily detected using the new method, the extent and intensity of both holes are consistent with other data sources.
Long distance low and medium frequency (below 2 MHz) propagation along paths north of due west over high and upper middle latitudes is poor. Propagation on long distance northeast-southwest paths is fair to good.
The geomagnetic field is expected to be quiet to active on September 11-13 due to effects from CH475. CME impacts are possible on September 13 and could cause an increase in disturbance levels.
| Coronal holes (1) | Coronal mass ejections (2) | M and X class flares (3) |
1) Effects from a coronal hole could reach Earth within the
next 5 days. When the high speed stream has arrived the color changes to
green.
2) Effects from a CME are likely to be observed at Earth within 96 hours.
3) There is a possibility of either M or X class flares within the next 48
hours.
Green: 0-20% probability, Yellow: 20-60% probability, Red: 60-100% probability.
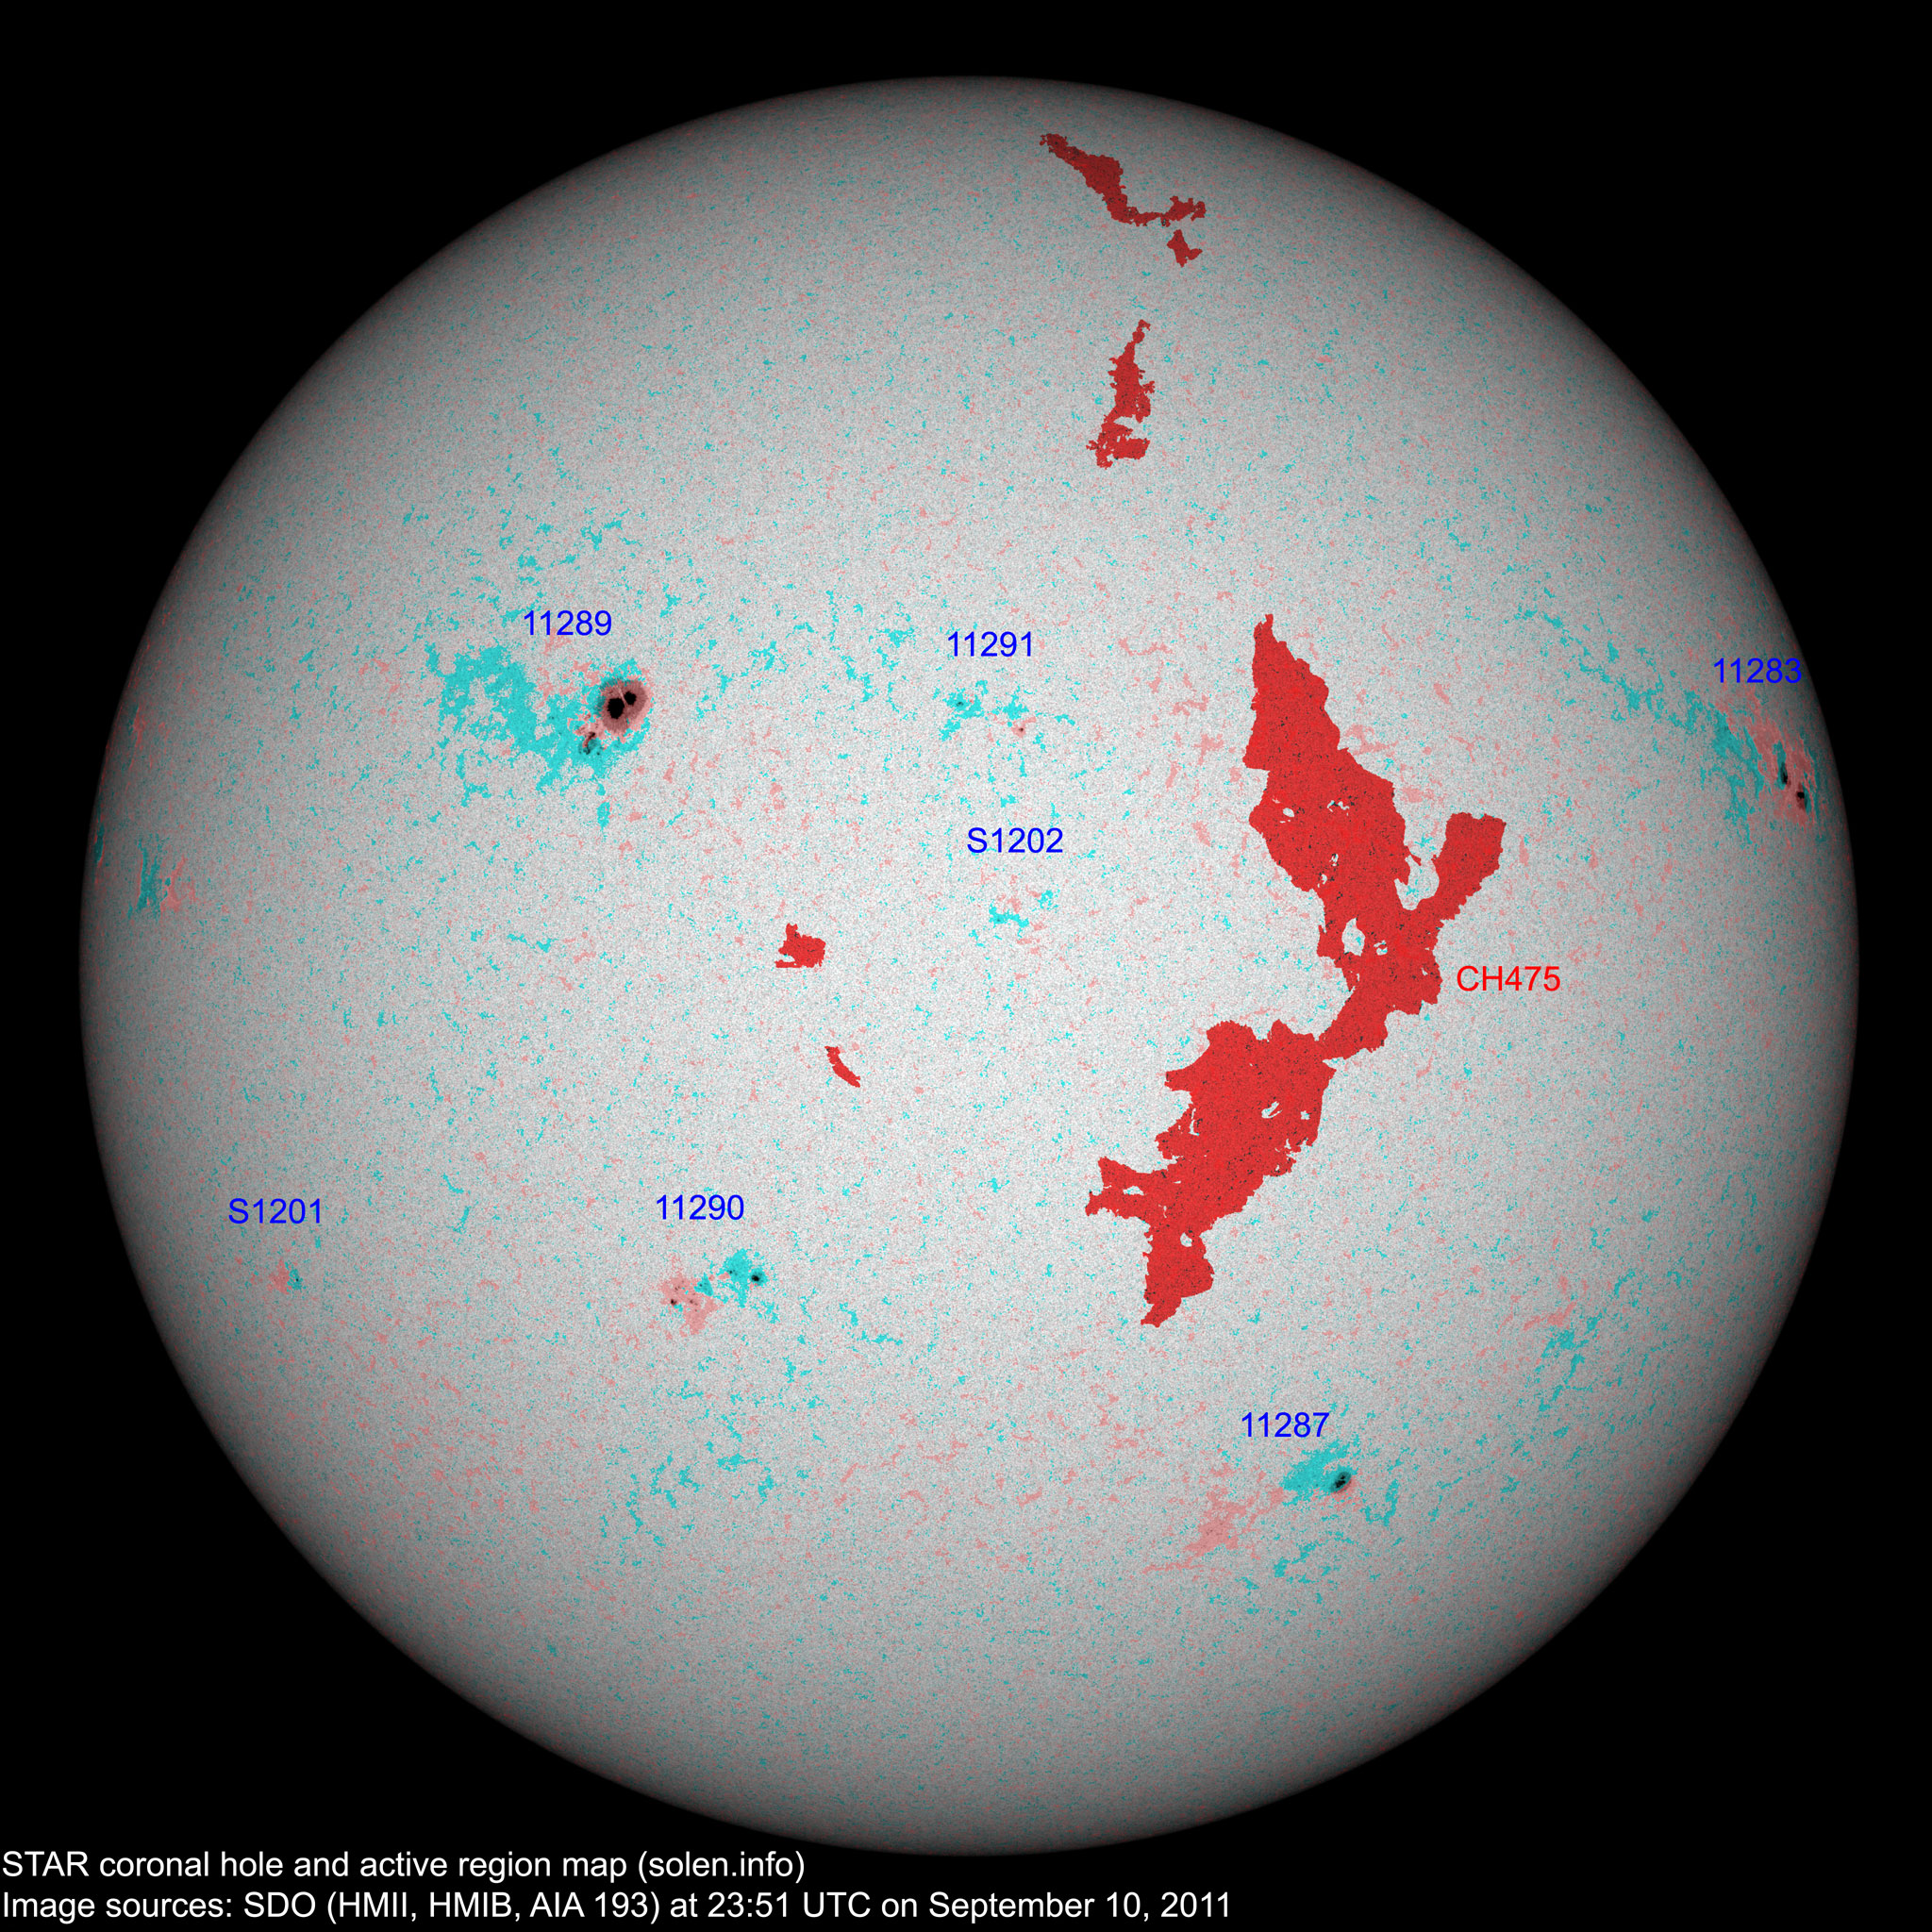
(Click on image for higher resolution image) Compare to the previous day's image
When available the active region map has a coronal hole polarity overlay where red (pink) is negative and blue (blue-green) is positive.
Data for all numbered solar regions according to the Solar Region Summary provided by NOAA/SWPC. Comments are my own, as is the STAR spot count (spots observed at or inside a few hours before midnight) and data for regions not numbered by SWPC or where SWPC has observed no spots. SWPC active region numbers in the table below and in the active region map above are the historic SWPC/USAF numbers.
| Active region | Date numbered detected |
Spot count | Location at midnight | Area | Classification | SDO / HMI 4K continuum image with polarity overlay |
Comment | |||
|---|---|---|---|---|---|---|---|---|---|---|
| SWPC | STAR SDO | SWPC | STAR | Current | Previous | |||||
| 11283 | 2011.08.29 2011.08.30 |
7 | 7 | N13W73 | 0200 | DSO | DSO |
 |
 |
beta-gamma |
| 11287 | 2011.09.02 2011.09.03 |
2 | 9 | S29W28 | 0070 | HSX | CSO |
 |
 |
|
| 11288 | 2011.09.03 2011.09.04 |
N19W36 | plage | |||||||
| S1196 | 2011.09.04 | S19W44 | plage | |||||||
| 11289 | 2011.09.05 2011.09.06 |
11 | 19 | N23E24 | 0450 | DHO | DHO |
 |
 |
beta-gamma-delta location: N23E24 |
| 11290 | 2011.09.07 2011.09.09 |
5 | 17 | S15E16 | 0050 | DRO | DRI |
 |
 |
beta-gamma location: S14E17 |
| 11291 | 2011.09.09 2011.09.10 |
2 | 4 | N23W03 | 0010 | DRO | BXO |
 |
 |
formerly region S1200 |
| S1201 | 2011.09.10 | 3 | S16E54 | 0000 | BXO |
 |
||||
| S1202 | 2011.09.10 | 2 | N11W03 | 0000 | BXO |
 |
||||
| Total spot count: | 27 | 61 | ||||||||
| Sunspot number: | 77 | 131 | (total spot count + 10 * number of spotted regions) | |||||||
| Classification adjusted SN: | 53 | 84 | (Sum of total spot count + classification adjustment for each AR. Classification adjustment: X=0, R=3, A/S=5, H/K=10) | |||||||
| Relative sunspot number (Wolf number): | 46 | 59 | k * (sunspot number). k = 0.6 for SWPC. k = 0.45 for STAR SDO | |||||||
| Month | Average measured solar flux | International sunspot number (SIDC) | Smoothed sunspot number | Average ap (3) |
|---|---|---|---|---|
| 2008.07 | 65.7 (SF minimum) | 0.5 | 2.8 (-0.4) | |
| 2008.12 | 69.2 | 0.8 | 1.7 (-) sunspot minimum |
3.25 |
| 2010.06 | 72.5 | 13.6 | 16.4 (+0.9) | 8.17 / 6.85 |
| 2010.07 | 79.8 | 16.1 | 16.7 (+0.3) | 6.31 / 5.15 |
| 2010.08 | 79.2 | 19.6 | 17.4 (+0.7) | 8.49 / 7.77 |
| 2010.09 | 81.1 | 25.2 | 19.6 (+2.2) | 5.33 / 5.45 |
| 2010.10 | 81.6 | 23.5 | 23.2 (+3.6) | 6.07 / 6.27 |
| 2010.11 | 82.5 | 21.5 | 26.5 (+3.3) | 4.80 / 5.50 |
| 2010.12 | 84.2 | 14.4 | 28.8 (+2.3) | 3.41 / 4.35 |
| 2011.01 | 83.6 | 19.1 | 31.0 (+2.2) | 4.32 / 5.51 |
| 2011.02 | 94.6 | 29.4 | 33.4 (+2.4) | 5.41 / 6.44 |
| 2011.03 | 115.0 | 56.2 | (36.2 predicted, +2.8) | 7.79 / 8.18 |
| 2011.04 | 112.6 | 54.4 | (39.1 predicted, +2.9) | 9.71 / 8.83 |
| 2011.05 | 95.8 | 41.6 | (42.4 predicted, +3.3) | 9.18 / 8.94 |
| 2011.06 | 95.8 | 37.0 | (46.1 predicted, +3.7) | 8.96 |
| 2011.07 | 94.2 | 43.9 | (50.3 predicted, +4.2) | 9.14 |
| 2011.08 | 101.7 | 50.6 | (54.4 predicted, +4.1) | 8.16 |
| 2011.09 | 114.5 (1) | 30.6 (2A) / 91.9 (2B) | (56.7 predicted, +2.3) | (11.74) |
1) Running average based on the daily 20:00 UTC observed solar flux value at
2800 MHz.
2A) Current impact on the monthly sunspot number based on the Boulder
(NOAA/SWPC) sunspot number (accumulated daily sunspots / month days). The
official SIDC international sunspot number is typically 30-50% lower. 2B) Month
average to date.
3) Running average based on the preliminary daily SWPC ap indices.
Values in red are based on the official NGDC
ap indices.
This report has been prepared by Jan Alvestad. It is based on analysis of data from whatever sources are available at the time the report is prepared. All time references are to the UTC day. Comments and suggestions are always welcome.
SDO images are courtesy of NASA/SDO and the AIA, EVE, and HMI science teams.