
Last update December 2, 2002 at 03:50 UTC.
[Solar and geomagnetic data
- last 4 weeks (updated daily)]
[Solar wind and electron
fluence charts (updated daily)]
[Solar cycles 21-23 (last
update December 2, 2002)]
[Solar cycles 1-20]
[Graphical comparison of
cycles 21, 22 and 23 (last update December 2, 2002)]
[Graphical comparison of
cycles 10, 13, 17, 20 and 23 (last update December 2, 2002)]
[Historical solar and geomagnetic
data charts 1954-2002 (last update October 13, 2002)]
[Archived reports (last update December 1, 2002)]
The geomagnetic field was unsettled to active on December 1. Solar wind speed ranged between 457 and 558 km/sec under the influence of a coronal stream.
Solar flare activity was low. Solar flux was 149.6, the planetary A
index was 16 (STAR Ap - based on the mean of three hour ap indices: 17.1).
Three hour interval K indices: 43344333 (planetary), 33333422 (Boulder).
The background x-ray flux is at the class B5 level.
At midnight there were 5 spotted regions on the visible disk, 1 of which has not yet been numbered. A total of 6 C class events was recorded during the day.
Region 10205 decayed slowly and quietly. If the current rate of decay persists the region will become spotless tomorrow.
Region 10207 added a few spots but didn't change much otherwise. Only C class flares are likely at this time. Flare: C1.8
long duration event peaking at 16:51 UTC.
Region 10208 developed slowly and currently has mixed polarities. A minor M class flare is possible. Flares: C1.0
at 12:38 and C5.5 at 15:28 UTC.
Region 10209 decayed slowly and was mostly quiet. Flare: C1.7 at 03:58 UTC.
Region 10210 rotated out of view after noon. Flare: C1.3 at 02:35 UTC.
Spotted regions not yet numbered by SEC:
[S40] A new region emerged early in the day in the southeast quadrant. Location at midnight: S07E15.
November 29 - December 1: No obviously geoeffective CMEs noted.
Coronal hole history (starting late October 2002)
A coronal hole in the northern hemisphere could move into a geoeffective position on December 4-5.

Processed SOHO EIT 284 image at 01:06 UTC on December 2. Any black areas on the solar disk are likely coronal holes.
The geomagnetic field is expected to be quiet to unsettled on December 2-4. Long distance medium wave (AM) band propagation along east-west paths over high and upper middle latitudes is poor to very poor.
| Coronal holes (1) | Coronal mass ejections (2) | M and X class flares (3) |
1) Effects from a coronal hole could reach Earth within the
next 5 days.
2) Material from a CME is likely to impact Earth within 96 hours.
3) There is a possibility of either M or X class flares within the next 48
hours.
Green: 0-20% probability, Yellow: 20-60% probability, Red: 60-100% probability.
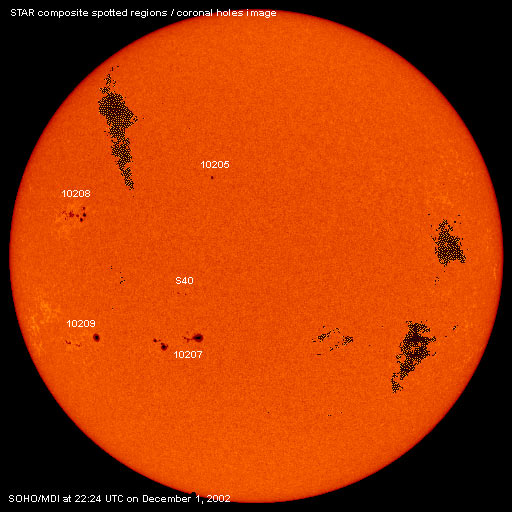
Composite image based on a SOHO/MDI continuum image and overlaid by a coronal hole image. Region numbering has been included.
Data for all numbered solar regions according to the Solar Region Summary provided by SEC/NOAA. Comments are my own, as is the STAR spot count (spots observed at or just prior to midnight) and data for regions not numbered by SEC or where SEC has observed no spots.
| Solar region | Date numbered | SEC spot count |
STAR spot count |
Location at midnight | Area | Classification | Comment |
|---|---|---|---|---|---|---|---|
| 10200 | 2002.11.20 | S03W80 | plage | ||||
| 10202 | 2002.11.24 | N15W29 | plage | ||||
| 10203 | 2002.11.26 | N09E04 | plage | ||||
| 10204 | 2002.11.27 | N20W15 | plage | ||||
| 10205 | 2002.11.27 | 1 | 1 | N19E10 | 0020 | HSX | |
| 10206 | 2002.11.27 | S27W09 | plage | ||||
| 10207 | 2002.11.27 | 20 | 26 | S19E20 | 0230 | EAI | |
| 10208 | 2002.11.29 | 16 | 23 | N10E49 | 0140 | DSO |
beta-gamma classification was DAI at midnight |
| 10209 | 2002.11.30 | 7 | 11 | S21E48 | 0170 | EAO | |
| 10210 | 2002.11.30 | 3 | S08W87 | 0060 | DSO | rotated out of view | |
| S40 | emerged on 2002.12.01 |
4 | S07E15 | 0020 | CSO | ||
| Total spot count: | 47 | 65 | |||||
| SSN: | 97 | 115 | |||||
| Month | Average solar flux at Earth |
International sunspot number | Smoothed sunspot number |
|---|---|---|---|
| 2000.04 | 184.2 | 125.5 | 120.8 cycle 23 sunspot max. |
| 2000.07 | 202.3 | 170.1 | 119.8 |
| 2001.11 | 210.6 | 106.5 | 115.5 (+1.5) |
| 2001.12 | 235.1 | 132.2 | 114.6 (-0.9) |
| 2002.01 | 226.6 | 114.1 | 113.5 (-1.1) |
| 2002.02 | 205.0 | 107.4 | 114.7 (+1.2) |
| 2002.03 | 179.5 | 98.4 | 113.4 (-1.3) |
| 2002.04 | 189.8 | 120.7 | 110.5 (-2.9) |
| 2002.05 | 178.4 | 120.8 | 108.8 (-1.7) |
| 2002.06 | 148.7 | 88.3 | (106.4 predicted, -2.4) |
| 2002.07 | 173.5 | 99.9 | (102.8 predicted, -3.6) |
| 2002.08 | 183.6 | 116.4 | (99.6 predicted, -3.2) |
| 2002.09 | 175.8 | 109.3 | (96.6 predicted, -3.0) |
| 2002.10 | 167.0 | 97.5 | (93.1 predicted, -3.5) |
| 2002.11 | 168.7 | 95.0 | (87.8 predicted, -5.3) |
| 2002.12 | 149.6 (1) | 3.1 (2) | (83.5 predicted, -4.3) |
1) Running average based on the daily 20:00 UT observed solar flux value at 2800
MHz.
2) Unofficial, accumulated value based on the Boulder (SEC/NOAA) sunspot number. The official
international sunspot number is typically 25-45% less.
This report has been prepared by Jan Alvestad. It is based partly on my own observations and interpretations, and partly on data from sources noted in solar links. Comments and suggestions are always welcome.
| [DX-Listeners' Club] [DX News] |