
Last update December 3, 2002 at 04:00 UTC.
[Solar and geomagnetic data
- last 4 weeks (updated daily)]
[Solar wind and electron
fluence charts (updated daily)]
[Solar cycles 21-23 (last
update December 2, 2002)]
[Solar cycles 1-20]
[Graphical comparison of
cycles 21, 22 and 23 (last update December 2, 2002)]
[Graphical comparison of
cycles 10, 13, 17, 20 and 23 (last update December 2, 2002)]
[Historical solar and geomagnetic
data charts 1954-2002 (last update October 13, 2002)]
[Archived reports (last update December 1, 2002)]
The geomagnetic field was quiet to unsettled on December 2. Solar wind speed ranged between 447 and 517 km/sec under the weakening influence of a coronal stream.
Solar flare activity was low. Solar flux was 146.1, the planetary A
index was 11 (STAR Ap - based on the mean of three hour ap indices: 12.5).
Three hour interval K indices: 23333332 (planetary), 23223323 (Boulder).
The background x-ray flux is at the class B4 level.
At midnight there were 5 spotted regions on the visible disk. A total of 3 C class events was recorded during the day.
Region 10205 decayed slowly and quietly.
Region 10207 was mostly unchanged. Flare: C1.8 at 20:33 UTC.
Region 10208 developed slowly early on, then decayed during the latter half of the day. A weak magnetic delta is evident
in the leading spot section and a minor M class flare is possible. Flares: C2.4/1N at
01:56 and C9.5 at 19:27 UTC.
Region 10209 decayed slowly and lost most of its trailing spots.
New region 10211 emerged on December 1, decayed on December 2 and was spotless by midnight.
New region 10212 rotated into view at the northeast limb early in the day.
November 28 - December 2: No obviously geoeffective CMEs noted.
December 2: A bright and large CME was observed in LASCO C2 images beginning at 18:06 UTC. The CME first appeared off of the northwest limb and became a full halo CME in LASCO C3 images. The CME had a backsided origin.
Coronal hole history (starting late October 2002)
A coronal hole in the northern hemisphere could move into a geoeffective position on December 4-5.

Processed SOHO EIT 284 image at 19:06 UTC on December 2. Any black areas on the solar disk are likely coronal holes.
The geomagnetic field is expected to be quiet to unsettled on December 3-5. Long distance medium wave (AM) band propagation along east-west paths over high and upper middle latitudes is poor.
| Coronal holes (1) | Coronal mass ejections (2) | M and X class flares (3) |
1) Effects from a coronal hole could reach Earth within the
next 5 days.
2) Material from a CME is likely to impact Earth within 96 hours.
3) There is a possibility of either M or X class flares within the next 48
hours.
Green: 0-20% probability, Yellow: 20-60% probability, Red: 60-100% probability.
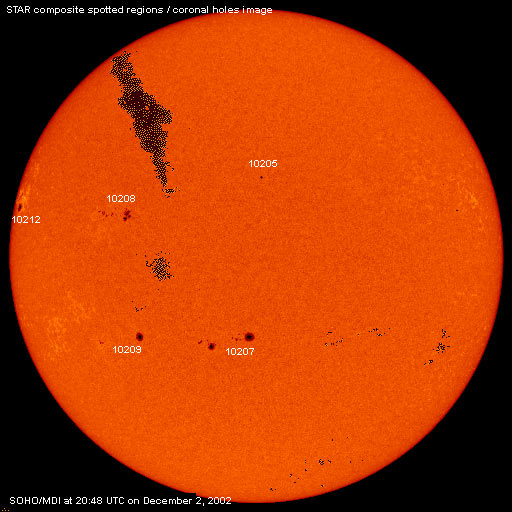
Composite image based on a SOHO/MDI continuum image and overlaid by a coronal hole image. Region numbering has been included.
Data for all numbered solar regions according to the Solar Region Summary provided by SEC/NOAA. Comments are my own, as is the STAR spot count (spots observed at or just prior to midnight) and data for regions not numbered by SEC or where SEC has observed no spots.
| Solar region | Date numbered | SEC spot count |
STAR spot count |
Location at midnight | Area | Classification | Comment |
|---|---|---|---|---|---|---|---|
| 10202 | 2002.11.24 | 4 | N13W40 | 0020 | BXO |
reemerged briefly, spotless at midnight |
|
| 10203 | 2002.11.26 | N09W09 | plage | ||||
| 10204 | 2002.11.27 | 10 | N16W26 | 0020 | BXO |
reemerged briefly, only one spot observed during early afternoon, spotless at midnight |
|
| 10205 | 2002.11.27 | 1 | 1 | N19W03 | 0000 | AXX |
area was near 0020, classification HSX at midnight |
| 10206 | 2002.11.27 | S27W22 | plage | ||||
| 10207 | 2002.11.27 | 20 | 17 | S20E06 | 0290 | EAO | |
| 10208 | 2002.11.29 | 22 | 26 | N10E35 | 0170 | DAI | beta-gamma-delta |
| 10209 | 2002.11.30 | 10 | 7 | S20E35 | 0170 | ESO | |
| 10211 | 2002.12.02 | 4 | S08E04 | 0020 | BXO | now spotless | |
| 10212 | 2002.12.02 | 4 | 5 | N13E75 | 0160 | CAO | |
| Total spot count: | 75 | 56 | |||||
| SSN: | 155 | 106 | |||||
| Month | Average solar flux at Earth |
International sunspot number | Smoothed sunspot number |
|---|---|---|---|
| 2000.04 | 184.2 | 125.5 | 120.8 cycle 23 sunspot max. |
| 2000.07 | 202.3 | 170.1 | 119.8 |
| 2001.11 | 210.6 | 106.5 | 115.5 (+1.5) |
| 2001.12 | 235.1 | 132.2 | 114.6 (-0.9) |
| 2002.01 | 226.6 | 114.1 | 113.5 (-1.1) |
| 2002.02 | 205.0 | 107.4 | 114.7 (+1.2) |
| 2002.03 | 179.5 | 98.4 | 113.4 (-1.3) |
| 2002.04 | 189.8 | 120.7 | 110.5 (-2.9) |
| 2002.05 | 178.4 | 120.8 | 108.8 (-1.7) |
| 2002.06 | 148.7 | 88.3 | (106.4 predicted, -2.4) |
| 2002.07 | 173.5 | 99.9 | (102.8 predicted, -3.6) |
| 2002.08 | 183.6 | 116.4 | (99.6 predicted, -3.2) |
| 2002.09 | 175.8 | 109.3 | (96.6 predicted, -3.0) |
| 2002.10 | 167.0 | 97.5 | (93.1 predicted, -3.5) |
| 2002.11 | 168.7 | 95.0 | (87.8 predicted, -5.3) |
| 2002.12 | 147.9 (1) | 8.1 (2) | (83.5 predicted, -4.3) |
1) Running average based on the daily 20:00 UT observed solar flux value at 2800
MHz.
2) Unofficial, accumulated value based on the Boulder (SEC/NOAA) sunspot number. The official
international sunspot number is typically 25-45% less.
This report has been prepared by Jan Alvestad. It is based partly on my own observations and interpretations, and partly on data from sources noted in solar links. Comments and suggestions are always welcome.
| [DX-Listeners' Club] [DX News] |