
Last update November 7, 2002 at 04:10 UTC. Minor update posted at 07:13 UTC.
[Solar and geomagnetic data
- last 4 weeks (updated daily)]
[Solar wind and electron
fluence charts (updated daily)]
[Solar cycles 21-23 (last
update November 2, 2002)]
[Solar cycles 1-20]
[Graphical comparison of
cycles 21, 22 and 23 (last update November, 2002)]
[Graphical comparison of
cycles 10, 13, 17, 20 and 23 (last update November 2, 2002)]
[Historical solar and geomagnetic
data charts 1954-2002 (last update October 13, 2002)]
[NEW! Archived reports (last update November 1, 2002)]
The geomagnetic field was unsettled to active on November 6. Solar wind speed ranged between 490 and 618 km/sec under the influence of a coronal stream.
Solar flare activity was low. Solar flux was 184.5, the planetary A
index was 19 (STAR Ap - based on the mean of three hour ap indices: 19.9).
Three hour interval K indices: 43344443 (planetary), 43343433 (Boulder).
The background x-ray flux is at the class B7 level.
At midnight there were 11 spotted regions on the visible disk. A total of 14 C class events were recorded during the day.
Region 10175 decayed with the main penumbra losing more than half of its area..
Region 10176 was quiet and stable.
Region 10177 decayed significantly losing many trailing spots and some penumbral area. The main penumbra split into two
smaller penumbrae and the magnetic delta structure visible one day earlier disappeared early in the day. Flares:
C1.9 at 12:07, C3.7 at 16:42 and C7.3 at 23:16 UTC.
Region 10179 reemerged with a few small spots.
Region 10180 developed slowly with the main penumbrae increasing in size. There are currently three magnetic delta
structures, one each in the leading and trailing penumbrae and another one in a central penumbra. A major flare is possible. Flares:
C7.2 long duration event peaking at 05:32 (with an associated moderate type II sweep, this event had its origin near the trailing
magnetic delta), C2.7 at 14:38, C2.6 at 14:45 and a C4.5 long duration event peaking at 21:57 UTC.
Region 10182 decayed slowly and appears to be losing all trailing spots.
Region 10185 was quiet and decayed slightly losing penumbral area in the trailing spot section. A minor M class flare is
still possible.
Region 10186 decayed slowly and quietly.
New region 10187 emerged in the northeast quadrant on Nov.5 and was numbered on Nov.6. Flare:
C2.2 at 19:46 UTC.
New region 10188 emerged in the northeast quadrant on Nov.5, was numbered on Nov.6 and has been developing moderately
quickly. Flares: C3.7 at 16:42, C1.6 at 18:33 and C2.4 at 20:19 UTC.
New region 10189 rotated into view at the northeast limb on Nov.5, was numbered on Nov.6 and developed penumbra around the
single spot that day.
Comment added at 07:13 UTC on November 7: Some changes noted early today: Region 10188 continues to develop and possibly has a magnetic delta structure. Region 10179 has lost its spots again. Region 10189 has developed a trailing spot. Region 10177 has decayed further.
Two new regions are visible: One has emerged near the southeast limb and is currently located at approximately S16E65. Another has emerged northwest of region10175, current location approximately N20W64. This region had a single spot for a few hours yesterday as well.
November 4-5: No obviously geoeffective CMEs were observed.
November 6: A small CME was observed first in LASCO C2 images off the south pole and the southern part of the southeast limb beginning at 06:06 UTC. This CME was likely associated with the C7 long duration event in region 10180. Another CME was first observed in LASCO C2 images at 13:31 UTC over the northwest limb and the north pole. The CME became a partial halo CME and my have had a backside origin.
The southernmost extension of a coronal hole in the northern hemisphere could rotate into a geoeffective position on November 7.
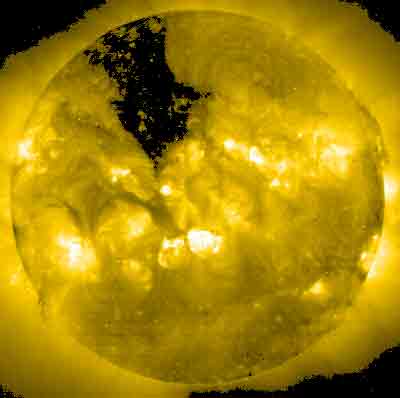
Enhanced SOHO EIT 284 image at 19:06 UTC on November 6. The black areas on the solar disk are coronal holes.
The geomagnetic field is expected to be quiet to active on November 7 and quiet to unsettled on November 8-9. Long distance medium wave (AM) band propagation along east-west paths over high and upper middle latitudes is poor to very poor.
| Coronal holes (1) | Coronal mass ejections (2) | M and X class flares (3) |
1) Effects from a coronal hole could reach Earth within the
next 5 days.
2) Material from a CME is likely to impact Earth within 96 hours.
3) There is a possibility of either M or X class flares within the next 48
hours.
Green: 0-20% probability, Yellow: 20-60% probability, Red: 60-100% probability.
Data for all numbered solar regions according to the Solar Region Summary provided by SEC/NOAA. Comments are my own, as is the STAR spot count (spots observed at or just prior to midnight) and data for regions not numbered by SEC or where SEC has observed no spots.
| Solar region | Date numbered | SEC spot count |
STAR spot count |
Location at midnight | Area | Classification | Comment |
|---|---|---|---|---|---|---|---|
| 10171 | 2002.10.25 | N11W80 | plage | ||||
| 10172 | 2002.10.27 | S16W75 | plage | ||||
| 10174 | 2002.10.29 | S26W47 | plage | ||||
| 10175 | 2002.10.29 | 5 | 2 | N14W54 | 0060 | CAO |
area was 0030 at midnight, classification HSX |
| 10176 | 2002.10.29 | 1 | 1 | N10W28 | 0130 | HSX | |
| 10177 | 2002.10.30 | 27 | 25 | N17W22 | 0300 | DKI | beta-gamma |
| 10179 | 2002.11.01 | 2 | 2 | N03E02 | 0010 | AXX | |
| 10180 | 2002.11.01 | 53 | 60 | S10W01 | 0560 | FKC | beta-gamma-delta |
| 10181 | 2002.11.02 | S07W08 | plage | ||||
| 10182 | 2002.11.02 | 5 | 4 | S18E16 | 0100 | CSO | |
| 10183 | 2002.11.03 | N19W63 | plage | ||||
| 10184 | 2002.11.03 | S06E12 | plage | ||||
| 10185 | 2002.11.03 | 14 | 17 | S13E36 | 0280 | DKO | |
| 10186 | 2002.11.05 | 6 | 8 | N19W12 | 0050 | DSO | |
| 10187 | 2002.11.06 | 4 | 5 | N07E07 | 0020 | CSO | formerly region S28 |
| 10188 | 2002.11.06 | 1 | 10 | N11E22 | 0020 | HRX |
formerly region S26 area 0070 at midnight, classification DRO |
| 10189 | 2002.11.06 | 1 | 1 | N12E56 | 0010 | AXX |
formerly region S27 classification was HSX at midnight, area 0020 |
| S20 | emerged on 2002.10.31 |
N15W40 | plage | ||||
| S25 | emerged on 2002.11.05 |
N15E06 | plage | ||||
| Total spot count: | 119 | 135 | |||||
| SSN: | 229 | 245 | |||||
| Month | Average solar flux at Earth |
International sunspot number | Smoothed sunspot number |
|---|---|---|---|
| 2000.04 | 184.2 | 125.5 | 120.8 cycle 23 sunspot max. |
| 2000.07 | 202.3 | 170.1 | 119.8 |
| 2001.10 | 207.6 | 125.5 | 114.0 (-0.1) |
| 2001.11 | 210.6 | 106.5 | 115.5 (+1.5) |
| 2001.12 | 235.1 | 132.2 | 114.6 (-0.9) |
| 2002.01 | 226.6 | 114.1 | 113.5 (-1.1) |
| 2002.02 | 205.0 | 107.4 | 114.7 (+1.2) |
| 2002.03 | 179.5 | 98.4 | 113.4 (-1.3) |
| 2002.04 | 189.8 | 120.7 | 110.5 (-2.9) |
| 2002.05 | 178.4 | 120.8 | (108.2 predicted, -2.3) |
| 2002.06 | 148.7 | 88.3 | (104.5 predicted, -3.7) |
| 2002.07 | 173.5 | 99.9 | (99.6 predicted, -4.9) |
| 2002.08 | 183.6 | 116.4 | (95.6 predicted, -4.0) |
| 2002.09 | 175.8 | 109.3 | (91.8 predicted, -3.8) |
| 2002.10 | 167.0 | 97.5 | (87.7 predicted, -4.1) |
| 2002.11 | 173.5 (1) | 37.7 (2) | (82.4 predicted, -5.3) |
1) Running average based on the daily 20:00 UT observed solar flux value at 2800
MHz.
2) Unofficial, accumulated value based on the Boulder (SEC/NOAA) sunspot number. The official
international sunspot number is typically 25-45% less.
This report has been prepared by Jan Alvestad. It is based partly on my own observations and interpretations, and partly on data from sources noted in solar links. Comments and suggestions are always welcome.
| [DX-Listeners' Club] [DX News] |