
Last update November 9, 2002 at 03:20 UTC. Minor update posted at 17:08 UTC.
[Solar and geomagnetic data
- last 4 weeks (updated daily)]
[Solar wind and electron
fluence charts (updated daily)]
[Solar cycles 21-23 (last
update November 2, 2002)]
[Solar cycles 1-20]
[Graphical comparison of
cycles 21, 22 and 23 (last update November 2, 2002)]
[Graphical comparison of
cycles 10, 13, 17, 20 and 23 (last update November 2, 2002)]
[Historical solar and geomagnetic
data charts 1954-2002 (last update October 13, 2002)]
[Archived reports (last update November 9, 2002)]
The geomagnetic field was quiet to unsettled on November 8. Solar wind speed ranged between 361 and 477 km/sec.
Solar flare activity was low. Solar flux was 189.0, the planetary A
index was 8 (STAR Ap - based on the mean of three hour ap indices: 8.9).
Three hour interval K indices: 22223232 (planetary), 12213321 (Boulder).
The background x-ray flux is at the class B8 level.
At midnight there were 10 spotted regions on the visible disk, 1 of which has not yet been numbered. A total of 11 low level C class events were recorded during the day.
Region 10175 decayed an was spotless by late evening.
Region 10176 was quiet and stable.
Region 10177 was quiet and decayed further losing a third of its penumbral area.
Region 10180 decayed in the trailing spot section where the easternmost penumbra lost more than half of its area and its
magnetic delta structure. Slow growth was noted in the leading spot section as well as in the westernmost part of the intermediate
spots, both of these areas contain a magnetic delta structure. There is still a chance of a major flare. Flares:
C1.3 at 05:06, C2.1 at 08:34, C2.7 at 10:09, C1.9 at 10:55, C5.8 at 12:24, C2.0 at 13:55, a long duration C7.4/1F event peaking at
18:20 and C1.3 at 22:20 UTC.
Region 10182 was quiet and stable.
Region 10184 reemerged with a few spots, then decayed quickly and was spotless by midnight.
Region 10185 was mostly unchanged and quiet.
Region 10186 decayed into spotless plage.
Region 10187 decayed into spotless plage.
Region 10188 decayed slowly and quietly.
Region 10189 developed slowly and quietly.
Region 10190 developed slowly and quietly.
New region 10191 rotated partly into view at the southeast limb. This appears to be a moderately large group and may be
capable of producing minor M class flares.
Spotted regions not yet numbered:
[S29]: A new region emerged west of region 10189 in the northeast quadrant on November 8. Location at midnight: N15E25.
Comment added at 17:08 UTC on November 9: Region 10180 produced an M4.6/2B flare at 13:23 UTC. This event, which was centered in the southeastern part of the region, was accompanied by a moderate type II sweep and a partial halo CME. The CME could reach Earth on November 12 and cause unsettled to minor storm conditions. Recently the above 10 MeV proton flux has been increasing and a weak proton event could start later today.
Solar wind density near Earth is increasing slowly and a coronal stream based disturbance will likely start within a few hours.
November 6-8: No obviously geoeffective CMEs were observed.
The southernmost extension of the northern polar coronal hole was in a geoeffective position on November 7. A trans equatorial coronal hole will likely be in a geoeffective position on November 12-13.
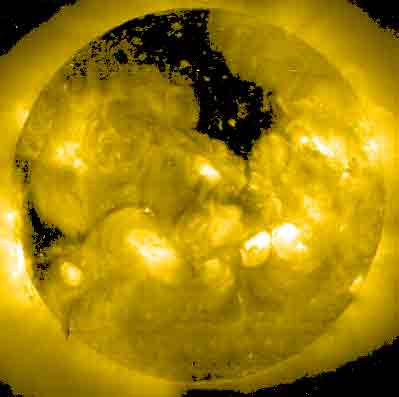
Enhanced SOHO EIT 284 image at 19:06 UTC on November 8. The black areas on the solar disk are coronal holes.
The geomagnetic field is expected to be quiet to unsettled on November 9 and quiet to active, possibly with minor storm intervals on November 10-11. Long distance medium wave (AM) band propagation along east-west paths over high and upper middle latitudes is poor.
| Coronal holes (1) | Coronal mass ejections (2) | M and X class flares (3) |
1) Effects from a coronal hole could reach Earth within the
next 5 days.
2) Material from a CME is likely to impact Earth within 96 hours.
3) There is a possibility of either M or X class flares within the next 48
hours.
Green: 0-20% probability, Yellow: 20-60% probability, Red: 60-100% probability.
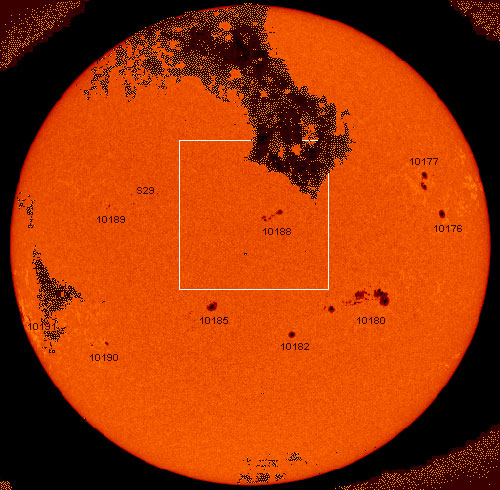
The above image is a test composite image displaying the currently spotted regions overlaid by a coronal hole image. The basis for the region image is a recent SOHO/MDI image. Region numbering and other image processing has been applied by myself.
Data for all numbered solar regions according to the Solar Region Summary provided by SEC/NOAA. Comments are my own, as is the STAR spot count (spots observed at or just prior to midnight) and data for regions not numbered by SEC or where SEC has observed no spots.
| Solar region | Date numbered | SEC spot count |
STAR spot count |
Location at midnight | Area | Classification | Comment |
|---|---|---|---|---|---|---|---|
| 10174 | 2002.10.29 | S26W73 | plage | ||||
| 10175 | 2002.10.29 | 1 | N15W82 | 0040 | HSX |
now spotless, area was 0020 at best early in the day |
|
| 10176 | 2002.10.29 | 1 | 1 | N10W55 | 0140 | HSX | |
| 10177 | 2002.10.30 | 8 | 6 | N18W50 | 0220 | DSO | |
| 10179 | 2002.11.01 | S01W21 | plage | ||||
| 10180 | 2002.11.01 | 58 | 57 | S10W28 | 0600 | FKC | beta-gamma-delta |
| 10181 | 2002.11.02 | S07W34 | plage | ||||
| 10182 | 2002.11.02 | 1 | 1 | S18W11 | 0070 | HSX | |
| 10183 | 2002.11.03 | N19W89 | plage | ||||
| 10184 | 2002.11.03 | 3 | S05W15 | 0010 | AXX | now spotless | |
| 10185 | 2002.11.03 | 16 | 19 | S12E10 | 0170 | DAO | |
| 10186 | 2002.11.05 | 4 | N20W37 | 0010 | BXO | now spotless | |
| 10187 | 2002.11.06 | 4 | N08W18 | 0010 | BXO | now spotless | |
| 10188 | 2002.11.06 | 17 | 13 | N10W06 | 0110 | DSI | |
| 10189 | 2002.11.06 | 4 | 3 | N13E32 | 0030 | CSO | |
| 10190 | 2002.11.07 | 4 | 6 | S22E42 | 0040 | CAO |
classification was DAO at midnight |
| 10191 | 2002.11.08 | 1 | 9 | S17E74 | 0060 | HSX |
beta-delta? area near 0200 at midnight, classification was DAI then |
| S20 | emerged on 2002.10.31 |
N15W66 | plage | ||||
| S25 | emerged on 2002.11.05 |
N15W20 | plage | ||||
| S29 | emerged on 2002.11.08 |
2 | N15E25 | 0020 | HRX | ||
| Total spot count: | 122 | 117 | |||||
| SSN: | 252 | 217 | |||||
| Month | Average solar flux at Earth |
International sunspot number | Smoothed sunspot number |
|---|---|---|---|
| 2000.04 | 184.2 | 125.5 | 120.8 cycle 23 sunspot max. |
| 2000.07 | 202.3 | 170.1 | 119.8 |
| 2001.10 | 207.6 | 125.5 | 114.0 (-0.1) |
| 2001.11 | 210.6 | 106.5 | 115.5 (+1.5) |
| 2001.12 | 235.1 | 132.2 | 114.6 (-0.9) |
| 2002.01 | 226.6 | 114.1 | 113.5 (-1.1) |
| 2002.02 | 205.0 | 107.4 | 114.7 (+1.2) |
| 2002.03 | 179.5 | 98.4 | 113.4 (-1.3) |
| 2002.04 | 189.8 | 120.7 | 110.5 (-2.9) |
| 2002.05 | 178.4 | 120.8 | (108.2 predicted, -2.3) |
| 2002.06 | 148.7 | 88.3 | (104.5 predicted, -3.7) |
| 2002.07 | 173.5 | 99.9 | (99.6 predicted, -4.9) |
| 2002.08 | 183.6 | 116.4 | (95.6 predicted, -4.0) |
| 2002.09 | 175.8 | 109.3 | (91.8 predicted, -3.8) |
| 2002.10 | 167.0 | 97.5 | (87.7 predicted, -4.1) |
| 2002.11 | 177.5 (1) | 54.8 (2) | (82.4 predicted, -5.3) |
1) Running average based on the daily 20:00 UT observed solar flux value at 2800
MHz.
2) Unofficial, accumulated value based on the Boulder (SEC/NOAA) sunspot number. The official
international sunspot number is typically 25-45% less.
This report has been prepared by Jan Alvestad. It is based partly on my own observations and interpretations, and partly on data from sources noted in solar links. Comments and suggestions are always welcome.
| [DX-Listeners' Club] [DX News] |