
Last update November 18, 2002 at 03:30 UTC.
[Solar and geomagnetic data
- last 4 weeks (updated daily)]
[Solar wind and electron
fluence charts (updated daily)]
[Solar cycles 21-23 (last
update November 2, 2002)]
[Solar cycles 1-20]
[Graphical comparison of
cycles 21, 22 and 23 (last update November 2, 2002)]
[Graphical comparison of
cycles 10, 13, 17, 20 and 23 (last update November 2, 2002)]
[Historical solar and geomagnetic
data charts 1954-2002 (last update October 13, 2002)]
[Archived reports (last update November 9, 2002)]
The geomagnetic field was quiet to unsettled on November 17. Solar wind speed ranged between 366 and 547 km/sec, generally decreasing all day. A weak solar wind shock was observed at ACE near 23h UTC on October 16. The interplanetary magnetic field was northwards most of the day, however, a gradual southwards swing was observed towards the end of the day.
Solar flare activity was moderate. Solar flux was 184.7, the planetary A
index was 8 (STAR Ap - based on the mean of three hour ap indices: 8.6).
Three hour interval K indices: 32113322 (planetary), 32111311 (Boulder).
The background x-ray flux is at the class C1 level.
At midnight there were 5 spotted regions on the visible disk. A total of 9 C and 1 M class events were recorded during the day. At 02:08 UTC on November 18 region 10198 produced an impulsive major M7.4 flare.
Region 10191 decayed slightly losing some trailing spots. There is still a magnetic delta structure in a trailing
penumbra. Major flares are possible.
Region 10192 lost some penumbral area but developed a few new spots. An M class flare is possible today and tomorrow
while the region is rotating around the northwest limb. Flare: C2.2 at 01:05 UTC
Region 10194 decayed and was spotless by noon.
Region 10195 was mostly unchanged and quiet.
Region 10197 was quiet and stable. The large penumbra became asymmetrical at its northern edge and a new spot could be
forming there.
Region 10198 developed slowly and is capable of producing further M class flares. A magnetic delta structure could be
forming at the trailing end of the leading penumbra. Flares: M2.0 at 14:54 and C7.9 at
21:37 UTC.
November 16: A fast full halo CME was observed during the morning with most of the ejected material seen off the southern hemisphere limbs. The origin of this CME is uncertain and may have been backsided.
A trans equatorial coronal hole will rotate into a geoeffective position on November 18.

Enhanced SOHO EIT 284 image at 19:06 UTC on November 13 (the next image will probably be produced on Nov.19 when new EIT 284 are available) . The black areas on the solar disk are coronal holes.
The geomagnetic field is expected to be quiet to unsettled on November 18-20. Long distance medium wave (AM) band propagation along east-west paths over high and upper middle latitudes is fair.
| Coronal holes (1) | Coronal mass ejections (2) | M and X class flares (3) |
1) Effects from a coronal hole could reach Earth within the
next 5 days.
2) Material from a CME is likely to impact Earth within 96 hours.
3) There is a possibility of either M or X class flares within the next 48
hours.
Green: 0-20% probability, Yellow: 20-60% probability, Red: 60-100% probability.
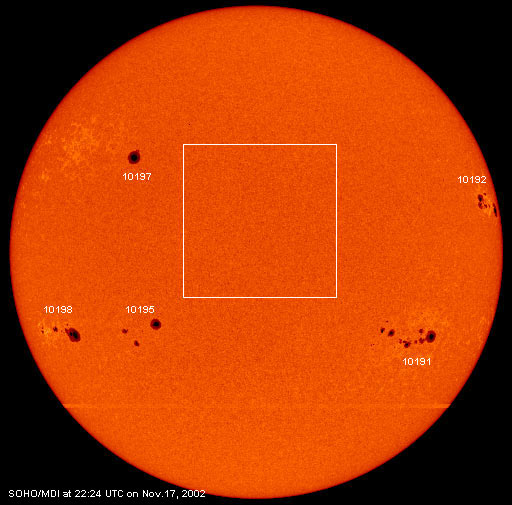
Lacking recent SOHO EIT images due to a CCD bakeout, the test composite image has been temporarily replaced by a SOHO/MDI image where only region numbers have been added.
Data for all numbered solar regions according to the Solar Region Summary provided by SEC/NOAA. Comments are my own, as is the STAR spot count (spots observed at or just prior to midnight) and data for regions not numbered by SEC or where SEC has observed no spots.
| Solar region | Date numbered | SEC spot count |
STAR spot count |
Location at midnight | Area | Classification | Comment |
|---|---|---|---|---|---|---|---|
| 10189 | 2002.11.06 | N17W86 | plage | ||||
| 10190 | 2002.11.07 | S22W81 | plage | ||||
| 10191 | 2002.11.08 | 41 | 35 | S18W41 | 0580 | FKI | beta-gamma-delta |
| 10192 | 2002.11.11 | 15 | 18 | N12W74 | 0550 | EHO | |
| 10193 | 2002.11.12 | S02W45 | plage | ||||
| 10194 | 2002.11.13 | 3 | S17W12 | 0020 | CSO | now spotless | |
| 10195 | 2002.11.13 | 8 | 14 | S17E28 | 0340 | EHO | |
| 10196 | 2002.11.14 | S18W83 | plage | ||||
| 10197 | 2002.11.14 | 1 | 2 | N24E33 | 0280 | HHX | |
| 10198 | 2002.11.15 | 11 | 16 | S18E55 | 0590 | FKO | |
| Total spot count: | 79 | 85 | |||||
| SSN: | 139 | 135 | |||||
| Month | Average solar flux at Earth |
International sunspot number | Smoothed sunspot number |
|---|---|---|---|
| 2000.04 | 184.2 | 125.5 | 120.8 cycle 23 sunspot max. |
| 2000.07 | 202.3 | 170.1 | 119.8 |
| 2001.10 | 207.6 | 125.5 | 114.0 (-0.1) |
| 2001.11 | 210.6 | 106.5 | 115.5 (+1.5) |
| 2001.12 | 235.1 | 132.2 | 114.6 (-0.9) |
| 2002.01 | 226.6 | 114.1 | 113.5 (-1.1) |
| 2002.02 | 205.0 | 107.4 | 114.7 (+1.2) |
| 2002.03 | 179.5 | 98.4 | 113.4 (-1.3) |
| 2002.04 | 189.8 | 120.7 | 110.5 (-2.9) |
| 2002.05 | 178.4 | 120.8 | (109.0 predicted, -1-5) |
| 2002.06 | 148.7 | 88.3 | (107.0 predicted, -2.0) |
| 2002.07 | 173.5 | 99.9 | (103.6 predicted, -3.4) |
| 2002.08 | 183.6 | 116.4 | (100.2 predicted, -3.4) |
| 2002.09 | 175.8 | 109.3 | (96.4 predicted, -4.8) |
| 2002.10 | 167.0 | 97.5 | (92.3 predicted, -4.1) |
| 2002.11 | 183.1 (1) | 109.3 (2) | (87.0 predicted, -5.3) |
1) Running average based on the daily 20:00 UT observed solar flux value at 2800
MHz.
2) Unofficial, accumulated value based on the Boulder (SEC/NOAA) sunspot number. The official
international sunspot number is typically 25-45% less.
This report has been prepared by Jan Alvestad. It is based partly on my own observations and interpretations, and partly on data from sources noted in solar links. Comments and suggestions are always welcome.
| [DX-Listeners' Club] [DX News] |