
Last update November 19, 2002 at 02:50 UTC.
[Solar and geomagnetic data
- last 4 weeks (updated daily)]
[Solar wind and electron
fluence charts (updated daily)]
[Solar cycles 21-23 (last
update November 2, 2002)]
[Solar cycles 1-20]
[Graphical comparison of
cycles 21, 22 and 23 (last update November 2, 2002)]
[Graphical comparison of
cycles 10, 13, 17, 20 and 23 (last update November 2, 2002)]
[Historical solar and geomagnetic
data charts 1954-2002 (last update October 13, 2002)]
[Archived reports (last update November 9, 2002)]
The geomagnetic field was quiet to unsettled on November 18. Solar wind speed ranged between 354 and 388 km/sec.
Solar flare activity was high. Solar flux was 178.9, the planetary A
index was 12 (STAR Ap - based on the mean of three hour ap indices: 12.5).
Three hour interval K indices: 32323333 (planetary), 32322233 (Boulder).
The background x-ray flux is at the class B8 level.
At midnight there were 6 spotted regions on the visible disk, 1 of which has not yet been numbered. A total of 12 C and 1 M class events were recorded during the day.
Region 10191 decayed and lost penumbral area in all parts of the region. The magnetic delta structure disappeared. M
class flares are still possible. Flare: C4.5 at 00:24 UTC.
Region 10192 rotated partly out of view at the northwest limb. There is a possibility of an M class event today. Flares: C2.2/1F at
07:11, C2.2 at 16:17 and C6.3 at 16:57 UTC
Region 10195 decayed in the northern trailing penumbra, however, the leading penumbra increased its size and became
asymmetrical.
Region 10197 gained several trailing spots during the day. All of these spots disappeared by midnight leaving only the
large leading penumbra.
Region 10198 developed slowly and now has a magnetic delta structure in the leading penumbra. Further M class flares are
possible. Flare: Impulsive major M7.4/1F at 02:08 UTC.
Spotted regions not yet numbered:
[S32] A new bipolar region emerged just northwest of the leading penumbra of region 10198 late on November 18. Location at
midnight: S16E33.
November 17-18: No obviously geoeffective CMEs noted.
A trans equatorial coronal hole was in a geoeffective position on November 18.

Enhanced SOHO EIT 284 image at 23:29 UTC on November 18 . The black areas on the solar disk are coronal holes.
The geomagnetic field is expected to be quiet to unsettled on November 19-20 and unsettled to minor storm on November 21-22 due to a recurrent coronal stream. Long distance medium wave (AM) band propagation along east-west paths over high and upper middle latitudes is fair.
| Coronal holes (1) | Coronal mass ejections (2) | M and X class flares (3) |
1) Effects from a coronal hole could reach Earth within the
next 5 days.
2) Material from a CME is likely to impact Earth within 96 hours.
3) There is a possibility of either M or X class flares within the next 48
hours.
Green: 0-20% probability, Yellow: 20-60% probability, Red: 60-100% probability.
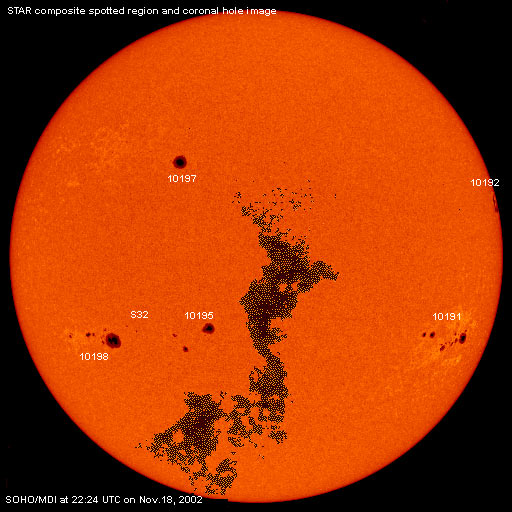
This is a composite image based on a SOHO/MDI image and overlaid by a coronal hole image. Region numbering has been included.
Data for all numbered solar regions according to the Solar Region Summary provided by SEC/NOAA. Comments are my own, as is the STAR spot count (spots observed at or just prior to midnight) and data for regions not numbered by SEC or where SEC has observed no spots.
| Solar region | Date numbered | SEC spot count |
STAR spot count |
Location at midnight | Area | Classification | Comment |
|---|---|---|---|---|---|---|---|
| 10191 | 2002.11.08 | 28 | 31 | S18W55 | 0540 | FAC | beta-gamma |
| 10192 | 2002.11.11 | 8 | 7 | N12W86 | 0280 | DAO | |
| 10193 | 2002.11.12 | S02W58 | plage | ||||
| 10194 | 2002.11.13 | S17W25 | plage | ||||
| 10195 | 2002.11.13 | 11 | 10 | S17E15 | 0290 | ESO |
classification was EAO at midnight |
| 10197 | 2002.11.14 | 1 | 1 | N24E20 | 0320 | HHX | |
| 10198 | 2002.11.15 | 21 | 28 | S18E43 | 0640 | FKI | beta-gamma-delta |
| S32 | emerged on 2002.11.18 |
2 | S16E33 | 0030 | DRO | ||
| Total spot count: | 69 | 79 | |||||
| SSN: | 119 | 139 | |||||
| Month | Average solar flux at Earth |
International sunspot number | Smoothed sunspot number |
|---|---|---|---|
| 2000.04 | 184.2 | 125.5 | 120.8 cycle 23 sunspot max. |
| 2000.07 | 202.3 | 170.1 | 119.8 |
| 2001.10 | 207.6 | 125.5 | 114.0 (-0.1) |
| 2001.11 | 210.6 | 106.5 | 115.5 (+1.5) |
| 2001.12 | 235.1 | 132.2 | 114.6 (-0.9) |
| 2002.01 | 226.6 | 114.1 | 113.5 (-1.1) |
| 2002.02 | 205.0 | 107.4 | 114.7 (+1.2) |
| 2002.03 | 179.5 | 98.4 | 113.4 (-1.3) |
| 2002.04 | 189.8 | 120.7 | 110.5 (-2.9) |
| 2002.05 | 178.4 | 120.8 | (109.0 predicted, -1-5) |
| 2002.06 | 148.7 | 88.3 | (107.0 predicted, -2.0) |
| 2002.07 | 173.5 | 99.9 | (103.6 predicted, -3.4) |
| 2002.08 | 183.6 | 116.4 | (100.2 predicted, -3.4) |
| 2002.09 | 175.8 | 109.3 | (96.4 predicted, -4.8) |
| 2002.10 | 167.0 | 97.5 | (92.3 predicted, -4.1) |
| 2002.11 | 182.7 (1) | 113.2 (2) | (87.0 predicted, -5.3) |
1) Running average based on the daily 20:00 UT observed solar flux value at 2800
MHz.
2) Unofficial, accumulated value based on the Boulder (SEC/NOAA) sunspot number. The official
international sunspot number is typically 25-45% less.
This report has been prepared by Jan Alvestad. It is based partly on my own observations and interpretations, and partly on data from sources noted in solar links. Comments and suggestions are always welcome.
| [DX-Listeners' Club] [DX News] |