
Last update November 20, 2002 at 03:30 UTC. Minor update posted at 16:00 UTC.
[Solar and geomagnetic data
- last 4 weeks (updated daily)]
[Solar wind and electron
fluence charts (updated daily)]
[Solar cycles 21-23 (last
update November 2, 2002)]
[Solar cycles 1-20]
[Graphical comparison of
cycles 21, 22 and 23 (last update November 2, 2002)]
[Graphical comparison of
cycles 10, 13, 17, 20 and 23 (last update November 2, 2002)]
[Historical solar and geomagnetic
data charts 1954-2002 (last update October 13, 2002)]
[Archived reports (last update November 9, 2002)]
The geomagnetic field was quiet to active on November 19. Solar wind speed ranged between 350 and 438 km/sec. The interplanetary magnetic field had a sustained southward interval after 21h UTC.
Solar flare activity was low. Solar flux was 168.2, the planetary A
index was 14 (STAR Ap - based on the mean of three hour ap indices: 14.8).
Three hour interval K indices: 33323334 (planetary), 23322233 (Boulder).
The background x-ray flux is at the class B8 level.
At midnight there were 6 spotted regions on the visible disk, 2 of which has not yet been numbered. A total of 10 C class events were recorded during the day, most of the events were optically uncorrelated. A long duration C4.9 event peaked at 07:37 UTC. The origin of this event was apparently a filament eruption northeast of region 10197. The associated CME did not appear to be geoeffective.
Region 10191 decayed further losing most of the southern trailing spots and a third of the total penumbral area. The
region was mostly quiet and will be rotating over the southwest limb today and early tomorrow.
Region 10195 decayed slowly in the trailing spot section and was otherwise mostly unchanged.
Region 10197 again had several trailing spots emerging during the day only to disappear again by midnight.
Region 10198 developed slowly with the leading penumbra becoming huge. This penumbra has a weak magnetic delta near its
southern edge. M class flares are
possible. Flare: C1.7 at 19:52 UTC.
Spotted regions not yet numbered:
[S32] A bipolar region emerged just northwest of the leading penumbra of region 10198 late on Nov. 18 and developed slowly
on Nov.19. Location at
midnight: S15E18.
[S33] A new region emerged east of region 10197 on November 19. Location at midnight: N26E24.
Comment added at 16:00 UTC on November 20: A strong coronal stream based disturbance has begun influencing the geomagnetic field. Solar wind density increased as early as 10:30 UTC at ACE and solar wind speed has been slowly increasing since then. The coronal stream arrived some hours earlier than expected and could produce active to major storm conditions for the remainder of today.
November 17-19: No obviously geoeffective CMEs noted.
A trans equatorial coronal hole was in a geoeffective position on November 18.

Enhanced SOHO EIT 284 image at 19:06 UTC on November 19 . The black areas on the solar disk are coronal holes.
The geomagnetic field is expected to be quiet to unsettled on November 20 and unsettled to minor storm on November 21-22 due to a recurrent coronal stream. Long distance medium wave (AM) band propagation along east-west paths over high and upper middle latitudes is fair to poor.
| Coronal holes (1) | Coronal mass ejections (2) | M and X class flares (3) |
1) Effects from a coronal hole could reach Earth within the
next 5 days.
2) Material from a CME is likely to impact Earth within 96 hours.
3) There is a possibility of either M or X class flares within the next 48
hours.
Green: 0-20% probability, Yellow: 20-60% probability, Red: 60-100% probability.
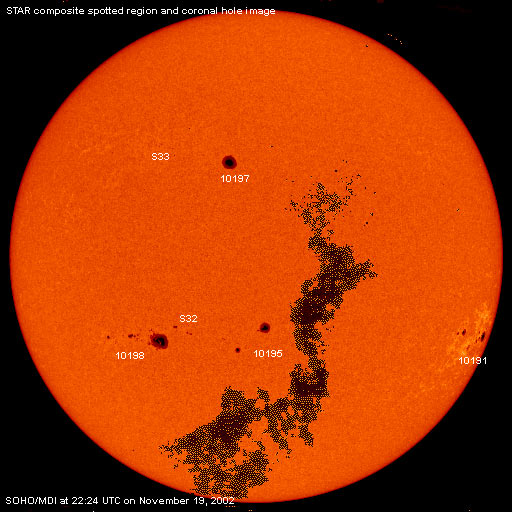
Composite image based on a SOHO/MDI image and overlaid by a coronal hole image. Region numbering has been included.
Data for all numbered solar regions according to the Solar Region Summary provided by SEC/NOAA. Comments are my own, as is the STAR spot count (spots observed at or just prior to midnight) and data for regions not numbered by SEC or where SEC has observed no spots.
| Solar region | Date numbered | SEC spot count |
STAR spot count |
Location at midnight | Area | Classification | Comment |
|---|---|---|---|---|---|---|---|
| 10191 | 2002.11.08 | 16 | 14 | S18W68 | 0420 | FAI | beta-gamma |
| 10193 | 2002.11.12 | S02W71 | plage | ||||
| 10194 | 2002.11.13 | S17W38 | plage | ||||
| 10195 | 2002.11.13 | 14 | 6 | S17E02 | 0260 | EAO | |
| 10197 | 2002.11.14 | 2 | 1 | N24E07 | 0320 | HKX | |
| 10198 | 2002.11.15 | 33 | 21 | S18E28 | 0580 | FKI |
beta-gamma-delta SEC spot number includes region S32 |
| S32 | emerged on 2002.11.18 |
5 | S15E18 | 0040 | DAO | ||
| S33 | emerged on 2002.11.19 |
5 | N26E24 | 0010 | AXX | ||
| Total spot count: | 65 | 52 | |||||
| SSN: | 105 | 112 | |||||
| Month | Average solar flux at Earth |
International sunspot number | Smoothed sunspot number |
|---|---|---|---|
| 2000.04 | 184.2 | 125.5 | 120.8 cycle 23 sunspot max. |
| 2000.07 | 202.3 | 170.1 | 119.8 |
| 2001.10 | 207.6 | 125.5 | 114.0 (-0.1) |
| 2001.11 | 210.6 | 106.5 | 115.5 (+1.5) |
| 2001.12 | 235.1 | 132.2 | 114.6 (-0.9) |
| 2002.01 | 226.6 | 114.1 | 113.5 (-1.1) |
| 2002.02 | 205.0 | 107.4 | 114.7 (+1.2) |
| 2002.03 | 179.5 | 98.4 | 113.4 (-1.3) |
| 2002.04 | 189.8 | 120.7 | 110.5 (-2.9) |
| 2002.05 | 178.4 | 120.8 | (109.0 predicted, -1-5) |
| 2002.06 | 148.7 | 88.3 | (107.0 predicted, -2.0) |
| 2002.07 | 173.5 | 99.9 | (103.6 predicted, -3.4) |
| 2002.08 | 183.6 | 116.4 | (100.2 predicted, -3.4) |
| 2002.09 | 175.8 | 109.3 | (96.4 predicted, -4.8) |
| 2002.10 | 167.0 | 97.5 | (92.3 predicted, -4.1) |
| 2002.11 | 182.1 (1) | 116.7 (2) | (87.0 predicted, -5.3) |
1) Running average based on the daily 20:00 UT observed solar flux value at 2800
MHz.
2) Unofficial, accumulated value based on the Boulder (SEC/NOAA) sunspot number. The official
international sunspot number is typically 25-45% less.
This report has been prepared by Jan Alvestad. It is based partly on my own observations and interpretations, and partly on data from sources noted in solar links. Comments and suggestions are always welcome.
| [DX-Listeners' Club] [DX News] |