
Last update November 21, 2002 at 03:40 UTC. Minor update posted at 10:32 UTC.
[Solar and geomagnetic data
- last 4 weeks (updated daily)]
[Solar wind and electron
fluence charts (updated daily)]
[Solar cycles 21-23 (last
update November 2, 2002)]
[Solar cycles 1-20]
[Graphical comparison of
cycles 21, 22 and 23 (last update November 2, 2002)]
[Graphical comparison of
cycles 10, 13, 17, 20 and 23 (last update November 2, 2002)]
[Historical solar and geomagnetic
data charts 1954-2002 (last update October 13, 2002)]
[Archived reports (last update November 9, 2002)]
The geomagnetic field was quiet to active on November 20. Solar wind speed ranged between 353 and 494 km/sec. A disturbance began influencing the geomagnetic field around noon. Solar wind density and speed increased as early as 10:30 UTC at ACE. The total field of the interplanetary magnetic field increased gradually in strength from 23h UTC and became very strong early on Nov.21. Although a coronal stream is still the most likely possibility, this disturbance may have other sources than a coronal hole.
Solar flare activity was moderate. Solar flux was 159.1, the planetary A
index was 17 (STAR Ap - based on the mean of three hour ap indices: 18.5).
Three hour interval K indices: 33132444 (planetary), 32231444 (Boulder).
The background x-ray flux is at the class B7 level.
At midnight there were 7 spotted regions on the visible disk, 1 of which has not yet been numbered. A total of 10 C and 1 M class events were recorded during the day.
Region 10191 decayed slowly and is rotating over the southwest limb. Flares: C1.1
at 04:50 and C1.0 at 15:25 UTC.
Region 10195 decayed slowly and quietly.
Region 10197 added a few small spots and was otherwise unchanged and quiet.
Region 10198 did not change much. The magnetic delta in the huge leading penumbra disappeared, however, there is a weak
delta in a trailing penumbra. Flares: C1.7 at 01:46, C1.4 at 03:12, C1.3 at 11:24, C3.9
at 16:33, an impulsive M1.4 at 18:07, C1.6 at 19:29 and an impulsive C5.2 at 23:56 UTC.
New region 10199 emerged in the northeast quadrant on Nov.19 and was numbered on Nov.20.
New region 10200 rotated into view at the east limb early in the day.
Spotted regions not yet numbered:
[S32] A bipolar region emerged just northwest of the leading penumbra of region 10198 late on Nov. 18 and developed slowly
on Nov.19 and 20. Location at
midnight: S16E03.
Comment added at 10:32 UTC on November 21: The unusually strong coronal stream in progress caused severe to very severe geomagnetic storming during the 06-09h UTC interval with the 3-hour planetary A index reaching 144 (as far as I can recall this is the highest 3-hour ap value associated with a coronal stream disturbance, at least since the years prior to the last sunspot minimum). Solar wind speed has levelled out just below 700 km/sec. Active to major storming is likely for the remainder of the day.
November 18-20: No obviously geoeffective CMEs noted.
A trans equatorial coronal hole, possibly an extension of the southern polar coronal hole, was in a geoeffective position on November 18.

Enhanced SOHO EIT 284 image at 19:05 UTC on November 20 . The black areas on the solar disk are coronal holes.
The geomagnetic field is expected to be unsettled to major storm on November 21 and unsettled to minor storm on Nov.22 under the influence of a coronal stream. Long distance medium wave (AM) band propagation along east-west paths over high and upper middle latitudes is poor to very poor.
| Coronal holes (1) | Coronal mass ejections (2) | M and X class flares (3) |
1) Effects from a coronal hole could reach Earth within the
next 5 days.
2) Material from a CME is likely to impact Earth within 96 hours.
3) There is a possibility of either M or X class flares within the next 48
hours.
Green: 0-20% probability, Yellow: 20-60% probability, Red: 60-100% probability.
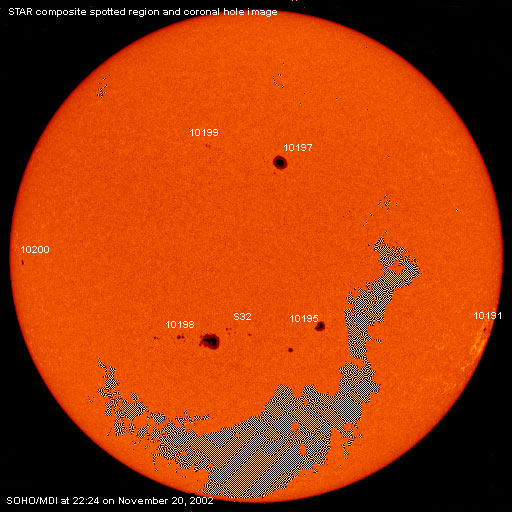
Composite image based on a SOHO/MDI image and overlaid by a coronal hole image. Region numbering has been included.
Data for all numbered solar regions according to the Solar Region Summary provided by SEC/NOAA. Comments are my own, as is the STAR spot count (spots observed at or just prior to midnight) and data for regions not numbered by SEC or where SEC has observed no spots.
| Solar region | Date numbered | SEC spot count |
STAR spot count |
Location at midnight | Area | Classification | Comment |
|---|---|---|---|---|---|---|---|
| 10191 | 2002.11.08 | 7 | 1 | S18W81 | 0200 | FAO |
area was 0040 in an HAX group at midnight |
| 10193 | 2002.11.12 | S02W84 | plage | ||||
| 10194 | 2002.11.13 | S17W51 | plage | ||||
| 10195 | 2002.11.13 | 7 | 5 | S17W11 | 0190 | EAO | |
| 10197 | 2002.11.14 | 2 | 5 | N24W06 | 0310 | HHX | |
| 10198 | 2002.11.15 | 30 | 24 | S18E15 | 0580 | FKC |
beta-gamma-delta SEC spot number includes region S32 |
| 10199 | 2002.11.20 | 3 | 4 | N27E13 | 0030 | AXX |
formerly region S33, classification was HRX at midnight |
| 10200 | 2002.11.20 | 1 | 1 | N00E71 | 0060 | HSX |
latitude appears to be S02 rather than N00 |
| S32 | emerged on 2002.11.18 |
6 | S16E03 | 0040 | DAO | ||
| Total spot count: | 50 | 46 | |||||
| SSN: | 110 | 116 | |||||
| Month | Average solar flux at Earth |
International sunspot number | Smoothed sunspot number |
|---|---|---|---|
| 2000.04 | 184.2 | 125.5 | 120.8 cycle 23 sunspot max. |
| 2000.07 | 202.3 | 170.1 | 119.8 |
| 2001.10 | 207.6 | 125.5 | 114.0 (-0.1) |
| 2001.11 | 210.6 | 106.5 | 115.5 (+1.5) |
| 2001.12 | 235.1 | 132.2 | 114.6 (-0.9) |
| 2002.01 | 226.6 | 114.1 | 113.5 (-1.1) |
| 2002.02 | 205.0 | 107.4 | 114.7 (+1.2) |
| 2002.03 | 179.5 | 98.4 | 113.4 (-1.3) |
| 2002.04 | 189.8 | 120.7 | 110.5 (-2.9) |
| 2002.05 | 178.4 | 120.8 | (109.0 predicted, -1-5) |
| 2002.06 | 148.7 | 88.3 | (107.0 predicted, -2.0) |
| 2002.07 | 173.5 | 99.9 | (103.6 predicted, -3.4) |
| 2002.08 | 183.6 | 116.4 | (100.2 predicted, -3.4) |
| 2002.09 | 175.8 | 109.3 | (96.4 predicted, -4.8) |
| 2002.10 | 167.0 | 97.5 | (92.3 predicted, -4.1) |
| 2002.11 | 180.9 (1) | 120.4 (2) | (87.0 predicted, -5.3) |
1) Running average based on the daily 20:00 UT observed solar flux value at 2800
MHz.
2) Unofficial, accumulated value based on the Boulder (SEC/NOAA) sunspot number. The official
international sunspot number is typically 25-45% less.
This report has been prepared by Jan Alvestad. It is based partly on my own observations and interpretations, and partly on data from sources noted in solar links. Comments and suggestions are always welcome.
| [DX-Listeners' Club] [DX News] |