
Last update November 23, 2002 at 04:15 UTC.
[Solar and geomagnetic data
- last 4 weeks (updated daily)]
[Solar wind and electron
fluence charts (updated daily)]
[Solar cycles 21-23 (last
update November 2, 2002)]
[Solar cycles 1-20]
[Graphical comparison of
cycles 21, 22 and 23 (last update November 2, 2002)]
[Graphical comparison of
cycles 10, 13, 17, 20 and 23 (last update November 2, 2002)]
[Historical solar and geomagnetic
data charts 1954-2002 (last update October 13, 2002)]
[Archived reports (last update November 9, 2002)]
The geomagnetic field was unsettled to minor storm on November 22. Solar wind speed ranged between 548 and 707 km/sec under the influence of a coronal stream.
Solar flare activity was low. Solar flux was 149.1, the planetary A
index was 24 (STAR Ap - based on the mean of three hour ap indices: 24.9).
Three hour interval K indices: 54344433 (planetary), 54343423 (Boulder).
The background x-ray flux is at the class B7 level.
At midnight there were 6 spotted regions on the visible disk. A region behind the northeast limb has been fairly active and should rotate into view this weekend. A total of 5 C class events were recorded during the day.
Region 10195 developed slowly in the trailing spot section during the first half of the day, then decayed again and had
lost all the newly emerged spots by midnight.
Region 10197 was quiet and stable.
Region 10198 decayed slowly in the trailing spot section. M class flares are still possible. Flares: C1.0
at 02:18 and C3.4 at 15:42 UTC.
Region 10199 decayed and could become spotless today or tomorrow.
Region 10200 was quiet and stable.
Region 10201 developed quickly early in the day with many new spots emerging. Some of these spots had disappeared by the
end of the day.
November 20-22: No obviously geoeffective CMEs noted. A full halo CME observed on Nov.20 appears to have had a backside origin.
An extension of the southern polar coronal hole will rotate into a geoeffective position on Nov.24.
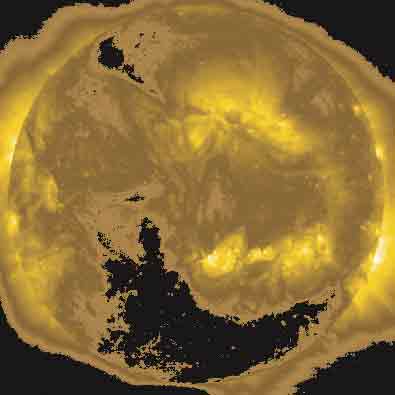
Processed SOHO EIT 284 image at 19:06 UTC on November 22. The black areas on the solar disk are coronal holes.
The geomagnetic field is expected to be quiet to minor storm on Nov.23 under the influence of a coronal stream. Quiet to unsettled is expected for Nov.24-25. Long distance medium wave (AM) band propagation along east-west paths over high and upper middle latitudes is very poor.
| Coronal holes (1) | Coronal mass ejections (2) | M and X class flares (3) |
1) Effects from a coronal hole could reach Earth within the
next 5 days.
2) Material from a CME is likely to impact Earth within 96 hours.
3) There is a possibility of either M or X class flares within the next 48
hours.
Green: 0-20% probability, Yellow: 20-60% probability, Red: 60-100% probability.
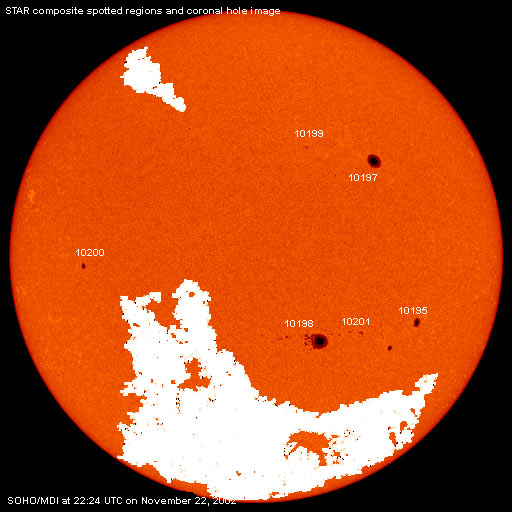
Composite image based on a SOHO/MDI continuum image and overlaid by a coronal hole image. Region numbering has been included.
Data for all numbered solar regions according to the Solar Region Summary provided by SEC/NOAA. Comments are my own, as is the STAR spot count (spots observed at or just prior to midnight) and data for regions not numbered by SEC or where SEC has observed no spots.
| Solar region | Date numbered | SEC spot count |
STAR spot count |
Location at midnight | Area | Classification | Comment |
|---|---|---|---|---|---|---|---|
| 10194 | 2002.11.13 | S17W77 | plage | ||||
| 10195 | 2002.11.13 | 9 | 5 | S17W37 | 0120 | EAO |
classification should be DAO |
| 10197 | 2002.11.14 | 1 | 2 | N24W33 | 0360 | HHX |
classification was EHO at midnight |
| 10198 | 2002.11.15 | 35 | 24 | S18W12 | 0500 | FKI | beta-gamma |
| 10199 | 2002.11.20 | 7 | 3 | N27W14 | 0030 | BXO | |
| 10200 | 2002.11.20 | 1 | 1 | N00E44 | 0060 | HSX | |
| 10201 | 2002.11.21 | 11 | 9 | S16W22 | 0040 | BXO |
beta-gamma classification was DRO at midnight |
| S34 | emerged on 2002.11.21 |
N14W83 | plage | ||||
| Total spot count: | 64 | 44 | |||||
| SSN: | 124 | 104 | |||||
| Month | Average solar flux at Earth |
International sunspot number | Smoothed sunspot number |
|---|---|---|---|
| 2000.04 | 184.2 | 125.5 | 120.8 cycle 23 sunspot max. |
| 2000.07 | 202.3 | 170.1 | 119.8 |
| 2001.10 | 207.6 | 125.5 | 114.0 (-0.1) |
| 2001.11 | 210.6 | 106.5 | 115.5 (+1.5) |
| 2001.12 | 235.1 | 132.2 | 114.6 (-0.9) |
| 2002.01 | 226.6 | 114.1 | 113.5 (-1.1) |
| 2002.02 | 205.0 | 107.4 | 114.7 (+1.2) |
| 2002.03 | 179.5 | 98.4 | 113.4 (-1.3) |
| 2002.04 | 189.8 | 120.7 | 110.5 (-2.9) |
| 2002.05 | 178.4 | 120.8 | (109.0 predicted, -1-5) |
| 2002.06 | 148.7 | 88.3 | (107.0 predicted, -2.0) |
| 2002.07 | 173.5 | 99.9 | (103.6 predicted, -3.4) |
| 2002.08 | 183.6 | 116.4 | (100.2 predicted, -3.4) |
| 2002.09 | 175.8 | 109.3 | (96.4 predicted, -4.8) |
| 2002.10 | 167.0 | 97.5 | (92.3 predicted, -4.1) |
| 2002.11 | 178.1 (1) | 129.3 (2) | (87.0 predicted, -5.3) |
1) Running average based on the daily 20:00 UT observed solar flux value at 2800
MHz.
2) Unofficial, accumulated value based on the Boulder (SEC/NOAA) sunspot number. The official
international sunspot number is typically 25-45% less.
This report has been prepared by Jan Alvestad. It is based partly on my own observations and interpretations, and partly on data from sources noted in solar links. Comments and suggestions are always welcome.
| [DX-Listeners' Club] [DX News] |