
Last update November 25, 2002 at 03:40 UTC.
[Solar and geomagnetic data
- last 4 weeks (updated daily)]
[Solar wind and electron
fluence charts (updated daily)]
[Solar cycles 21-23 (last
update November 2, 2002)]
[Solar cycles 1-20]
[Graphical comparison of
cycles 21, 22 and 23 (last update November 2, 2002)]
[Graphical comparison of
cycles 10, 13, 17, 20 and 23 (last update November 2, 2002)]
[Historical solar and geomagnetic
data charts 1954-2002 (last update October 13, 2002)]
[Archived reports (last update November 24, 2002)]
The geomagnetic field was unsettled to active on November 24. Solar wind speed ranged between 418 and 519 km/sec under the influence of a coronal stream.
Solar flare activity was low. Solar flux was 146.2, the planetary A
index was 16 (STAR Ap - based on the mean of three hour ap indices: 16.5).
Three hour interval K indices: 34334433 (planetary), 34334322 (Boulder).
The background x-ray flux is at the class B5 level.
At midnight there were 5 spotted regions on the visible disk. A total of 9 C class events were recorded during the day. A long duration C6.4 event peaking at 20:29 UTC had its origin in a large filament eruption in the northeast quadrant, see additional comments in CME section below.
Region 10195 decayed slowly. Flares: C1.2 at 04:49, C4.8 at 08:19 and C1.4 at
19:12 UTC.
Region 10197 was quiet and stable.
Region 10198 decayed significantly losing many small spots and even some of the penumbral area in the large leading
penumbra. Occasional M class flares are possible. Flares: C1.0 at 02:13, C1.1 at 11:21
and a C1.8 long duration event peaking at 18:09 UTC.
Region 10199 decayed and was spotless by midnight.
Region 10200 was quiet and stable.
Region 10201 decayed and was spotless by midnight. Flare: C1.8 at 03:47 UTC.
New region 10202 began to rotate into view at the northeast limb on Nov.23 and was numbered on Nov.24. The region was much
less active than on the previous two days and must have decayed significantly.
November 22-23: No obviously geoeffective CMEs noted.
November 24: A large halo CME was observed following a filament eruption in the northeast quadrant. In EIT images the first hints of an eruption in progress could be seen as early as 18:36 UTC. LASCO C2 images began showing a CME at the northeast limb at 20:30 UTC, while the first C3 image had the CME visible starting at 21:18 UTC. The CME quickly became a partial halo CME and could even be a full halo CME. It is uncertain if Earth will receive an impact from the main part of the CME. If that happens major storm conditions will be possible on November 27, otherwise only unsettled to minor storm is likely on the same day.
An extension of the southern polar coronal hole was in a geoeffective position on Nov.23-24. A small trans equatorial coronal hole could rotate into a geoeffective position on November 28.

Processed SOHO EIT 284 image at 19:06 UTC on November 24. The black areas on the solar disk are coronal holes. The white area in the northeast quadrant in the above image is an erupting filament.
The geomagnetic field is expected to be quiet to unsettled on Nov.25 and most of Nov.26. Another coronal stream could reach Earth late on Nov.26 and cause unsettled to active conditions. The CME observed late on Nov.24 could reach Earth early on Nov.27 and cause unsettled to major storm conditions. The possible presence of a coronal stream when this CME arrives could cause the disturbance to be less intense. Long distance medium wave (AM) band propagation along east-west paths over high and upper middle latitudes is poor.
| Coronal holes (1) | Coronal mass ejections (2) | M and X class flares (3) |
1) Effects from a coronal hole could reach Earth within the
next 5 days.
2) Material from a CME is likely to impact Earth within 96 hours.
3) There is a possibility of either M or X class flares within the next 48
hours.
Green: 0-20% probability, Yellow: 20-60% probability, Red: 60-100% probability.
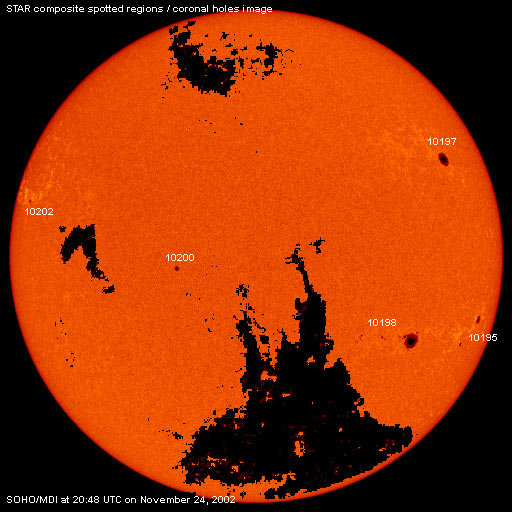
Composite image based on a SOHO/MDI continuum image and overlaid by a coronal hole image. Region numbering has been included.
Data for all numbered solar regions according to the Solar Region Summary provided by SEC/NOAA. Comments are my own, as is the STAR spot count (spots observed at or just prior to midnight) and data for regions not numbered by SEC or where SEC has observed no spots.
| Solar region | Date numbered | SEC spot count |
STAR spot count |
Location at midnight | Area | Classification | Comment |
|---|---|---|---|---|---|---|---|
| 10195 | 2002.11.13 | 6 | 3 | S16W66 | 0140 | DAO | |
| 10197 | 2002.11.14 | 3 | 1 | N26W58 | 0250 | HHX | |
| 10198 | 2002.11.15 | 36 | 22 | S18W25 | 0500 | FKC |
beta-gamma classification was FKI at midnight |
| 10199 | 2002.11.20 | 2 | N27W42 | 0010 | BXO | now spotless | |
| 10200 | 2002.11.20 | 1 | 1 | S01E17 | 0020 | HSX |
areas was approx. 0050 at midnight |
| 10201 | 2002.11.21 | 3 | S15W54 | 0020 | BXO | now spotless | |
| 10202 | 2002.11.24 | 2 | 5 | N14E66 | 0050 | CSO |
formerly region S35 classification was HSX at midnight, only positive polarity spots observed |
| Total spot count: | 53 | 32 | |||||
| SSN: | 123 | 82 | |||||
| Month | Average solar flux at Earth |
International sunspot number | Smoothed sunspot number |
|---|---|---|---|
| 2000.04 | 184.2 | 125.5 | 120.8 cycle 23 sunspot max. |
| 2000.07 | 202.3 | 170.1 | 119.8 |
| 2001.10 | 207.6 | 125.5 | 114.0 (-0.1) |
| 2001.11 | 210.6 | 106.5 | 115.5 (+1.5) |
| 2001.12 | 235.1 | 132.2 | 114.6 (-0.9) |
| 2002.01 | 226.6 | 114.1 | 113.5 (-1.1) |
| 2002.02 | 205.0 | 107.4 | 114.7 (+1.2) |
| 2002.03 | 179.5 | 98.4 | 113.4 (-1.3) |
| 2002.04 | 189.8 | 120.7 | 110.5 (-2.9) |
| 2002.05 | 178.4 | 120.8 | (109.0 predicted, -1-5) |
| 2002.06 | 148.7 | 88.3 | (107.0 predicted, -2.0) |
| 2002.07 | 173.5 | 99.9 | (103.6 predicted, -3.4) |
| 2002.08 | 183.6 | 116.4 | (100.2 predicted, -3.4) |
| 2002.09 | 175.8 | 109.3 | (96.4 predicted, -4.8) |
| 2002.10 | 167.0 | 97.5 | (92.3 predicted, -4.1) |
| 2002.11 | 175.5 (1) | 137.6 (2) | (87.0 predicted, -5.3) |
1) Running average based on the daily 20:00 UT observed solar flux value at 2800
MHz.
2) Unofficial, accumulated value based on the Boulder (SEC/NOAA) sunspot number. The official
international sunspot number is typically 25-45% less.
This report has been prepared by Jan Alvestad. It is based partly on my own observations and interpretations, and partly on data from sources noted in solar links. Comments and suggestions are always welcome.
| [DX-Listeners' Club] [DX News] |