
Last update November 27, 2002 at 04:00 UTC. Minor update posted at 09:23 UTC.
[Solar and geomagnetic data
- last 4 weeks (updated daily)]
[Solar wind and electron
fluence charts (updated daily)]
[Solar cycles 21-23 (last
update November 2, 2002)]
[Solar cycles 1-20]
[Graphical comparison of
cycles 21, 22 and 23 (last update November 2, 2002)]
[Graphical comparison of
cycles 10, 13, 17, 20 and 23 (last update November 2, 2002)]
[Historical solar and geomagnetic
data charts 1954-2002 (last update October 13, 2002)]
[Archived reports (last update November 24, 2002)]
The geomagnetic field was quiet to minor storm on November 26. Solar wind speed ranged between 349 and 601 km/sec. A solar wind shock was observed at SOHO at 21:21 UTC. Solar wind speed increased abruptly from 370 to 550 km/sec and the interplanetary magnetic field swung strongly southwards.
Solar flare activity was low. Solar flux was 142.3, the planetary A
index was 14 (STAR Ap - based on the mean of three hour ap indices: 14.6).
Three hour interval K indices: 33223325 (planetary), 31222225 (Boulder).
The background x-ray flux is at the class C1 level.
At midnight there were 7 spotted regions on the visible disk, 2of which have not yet been numbered. A total of 5 C class events were recorded during the day.
Region 10197 rotated to the northwest limb and was mostly unchanged. Flares: C1.0
at 12:12 and C3.6 at 18:35 UTC.
Region 10198 developed in the trailing spot section and may be capable of producing a minor M class flare. Flares: C1.3
long duration event peaking at 10:22 and C2.6 at 23:07 UTC.
Region 10200 decayed slowly and quietly.
Region 10202 was quiet and stable.
New region 10203 rotated into view early in the day at the northeast limb. This region is unimpressive and could soon
become spotless.
Spotted regions not yet numbered:
[S36] A new region rotated into view at the northeast limb and was located at N18E75 at midnight.
[S37] A new region rotated into view at the southeast limb. Location at midnight: S18E78.
Comment added at 09:23 UTC on November 27: Several changes observed during the first 9 hours of the day: The trailing spots in region 10198 are developing quickly. With the positive and negative polarity areas in that section being narrowly separated, there is an increasing possibility of an M class flare.
Region 10202 has added several trailing spots.
Two new regions have emerged quickly in the eastern hemisphere. One is located in the southeast quadrant, near S25E55, and recently had 5 spots. The other one is in the northeast quadrant and emerged in an area with bright plage. Its location was N15E52 and the region had 8 spots less than an hour ago.
The geomagnetic field has been at active levels early today with the planetary A (ap) index ranging between 27 and 33 during the three first 3-hour intervals.
November 25-26: No obviously geoeffective CMEs noted.
An extension of the southern polar coronal hole was in a geoeffective position on Nov.23-24. A trans equatorial coronal hole will rotate into a geoeffective position on November 27-28.

Processed SOHO EIT 284 image at 19:06 UTC on November 26. The black areas on the solar disk are coronal holes.
The geomagnetic field is expected to be unsettled to major storm on Nov.27 and quiet to active on November 28-29. A coronal stream could reach Earth on Nov.30 and cause unsettled to minor storm conditions. Long distance medium wave (AM) band propagation along east-west paths over high and upper middle latitudes is very poor.
| Coronal holes (1) | Coronal mass ejections (2) | M and X class flares (3) |
1) Effects from a coronal hole could reach Earth within the
next 5 days.
2) Material from a CME is likely to impact Earth within 96 hours.
3) There is a possibility of either M or X class flares within the next 48
hours.
Green: 0-20% probability, Yellow: 20-60% probability, Red: 60-100% probability.
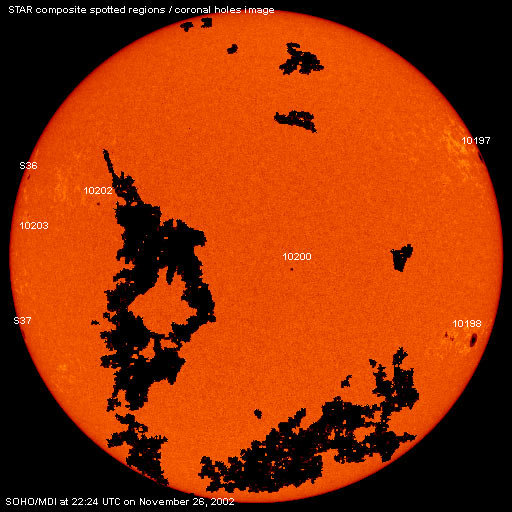
Composite image based on a SOHO/MDI continuum image and overlaid by a coronal hole image. Region numbering has been included.
Data for all numbered solar regions according to the Solar Region Summary provided by SEC/NOAA. Comments are my own, as is the STAR spot count (spots observed at or just prior to midnight) and data for regions not numbered by SEC or where SEC has observed no spots.
| Solar region | Date numbered | SEC spot count |
STAR spot count |
Location at midnight | Area | Classification | Comment |
|---|---|---|---|---|---|---|---|
| 10195 | 2002.11.13 | 4 | S16W92 | 0070 | CAO |
rotated out of view late on Nov.25 |
|
| 10197 | 2002.11.14 | 1 | 1 | N24W84 | 0250 | HHX | |
| 10198 | 2002.11.15 | 15 | 8 | S18W61 | 0390 | FKO | |
| 10199 | 2002.11.20 | 2 | N27W58 | 0010 | BXO |
spotless for the second consecutive day. SEC location was N28W54 one day earlier and should have been near N28W67. |
|
| 10200 | 2002.11.20 | 1 | 1 | S02W09 | 0020 | HSX | |
| 10201 | 2002.11.21 | S16W78 | |||||
| 10202 | 2002.11.24 | 5 | 1 | N13E41 | 0030 | CSO |
classification was HSX at midnight |
| 10203 | 2002.11.26 | 2 | 2 | N08E71 | 0020 | AXX | |
| S36 | visible on 2002.11.26 |
1 | N18E75 | 0050 | HAX | ||
| S37 | visible on 2002.11.26 |
1 | S18E78 | 0120 | HSX | ||
| Total spot count: | 30 | 15 | |||||
| SSN: | 100 | 85 | |||||
| Month | Average solar flux at Earth |
International sunspot number | Smoothed sunspot number |
|---|---|---|---|
| 2000.04 | 184.2 | 125.5 | 120.8 cycle 23 sunspot max. |
| 2000.07 | 202.3 | 170.1 | 119.8 |
| 2001.10 | 207.6 | 125.5 | 114.0 (-0.1) |
| 2001.11 | 210.6 | 106.5 | 115.5 (+1.5) |
| 2001.12 | 235.1 | 132.2 | 114.6 (-0.9) |
| 2002.01 | 226.6 | 114.1 | 113.5 (-1.1) |
| 2002.02 | 205.0 | 107.4 | 114.7 (+1.2) |
| 2002.03 | 179.5 | 98.4 | 113.4 (-1.3) |
| 2002.04 | 189.8 | 120.7 | 110.5 (-2.9) |
| 2002.05 | 178.4 | 120.8 | (109.0 predicted, -1-5) |
| 2002.06 | 148.7 | 88.3 | (107.0 predicted, -2.0) |
| 2002.07 | 173.5 | 99.9 | (103.6 predicted, -3.4) |
| 2002.08 | 183.6 | 116.4 | (100.2 predicted, -3.4) |
| 2002.09 | 175.8 | 109.3 | (96.4 predicted, -4.8) |
| 2002.10 | 167.0 | 97.5 | (92.3 predicted, -4.1) |
| 2002.11 | 172.8 (1) | 144.5 (2) | (87.0 predicted, -5.3) |
1) Running average based on the daily 20:00 UT observed solar flux value at 2800
MHz.
2) Unofficial, accumulated value based on the Boulder (SEC/NOAA) sunspot number. The official
international sunspot number is typically 25-45% less.
This report has been prepared by Jan Alvestad. It is based partly on my own observations and interpretations, and partly on data from sources noted in solar links. Comments and suggestions are always welcome.
| [DX-Listeners' Club] [DX News] |