
Last update November 29, 2002 at 04:00 UTC.
[Solar and geomagnetic data
- last 4 weeks (updated daily)]
[Solar wind and electron
fluence charts (updated daily)]
[Solar cycles 21-23 (last
update November 2, 2002)]
[Solar cycles 1-20]
[Graphical comparison of
cycles 21, 22 and 23 (last update November 2, 2002)]
[Graphical comparison of
cycles 10, 13, 17, 20 and 23 (last update November 2, 2002)]
[Historical solar and geomagnetic
data charts 1954-2002 (last update October 13, 2002)]
[Archived reports (last update November 24, 2002)]
The geomagnetic field was quiet to active on November 28. Solar wind speed ranged between 462 and 548 km/sec.
Solar flare activity was low. Solar flux was 139.7, the planetary A
index was 15 (STAR Ap - based on the mean of three hour ap indices: 16.5).
Three hour interval K indices: 34333332 (planetary), 34322432 (Boulder).
The background x-ray flux is at the class B4 level.
At midnight there were 7 spotted regions on the visible disk. A total of 15 C class events were recorded during the day.
Region 10198 rotated over the southwest limb with only a couple of spots remaining visible by the end of the day. Flares: C2.4
at 00:42, C3.7/1F at 01:07, C2.4 at 03:00, C1.0 at 04:37, C2.5 at 05:43, C4.3 at 08:21, C3.4 at 10:22, C8.4 long duration event
peaking at 11:36 and C1.7 at 12:56 UTC.
Region 10200 decayed and could become spotless today.
Region 10202 decayed and lost most of its penumbral area.
Region 10203 was quiet and stable.
Region 10204 was mostly unchanged and quiet.
Region 10205 was quiet and stable.
Region 10206 decayed and was spotless by early evening.
Region 10207 developed slowly and added a magnetic delta structure at the eastern end of the leading penumbra. M class
flares are possible. Flares: C3.5 at 14:04, C2.0 at 15:25, C1.1 at 16:38, C1.8 at 17:01
and C3.1 at 22:24 UTC.
November 26-28: No obviously geoeffective CMEs noted.
Coronal hole history (starting late October 2002)
A recurrent trans equatorial coronal hole was in a geoeffective position on November 27-28.
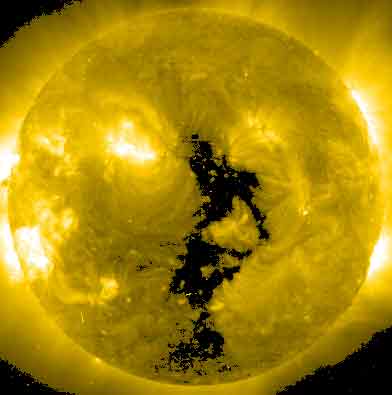
Processed SOHO EIT 284 image at 01:06 UTC on November 29. The black areas on the solar disk are coronal holes.
The geomagnetic field is expected to be quiet to active on November 29. A coronal stream will likely reach Earth on Nov.30 and could cause unsettled to minor storm conditions that day and on December 1. Long distance medium wave (AM) band propagation along east-west paths over high and upper middle latitudes is poor to very poor.
| Coronal holes (1) | Coronal mass ejections (2) | M and X class flares (3) |
1) Effects from a coronal hole could reach Earth within the
next 5 days.
2) Material from a CME is likely to impact Earth within 96 hours.
3) There is a possibility of either M or X class flares within the next 48
hours.
Green: 0-20% probability, Yellow: 20-60% probability, Red: 60-100% probability.
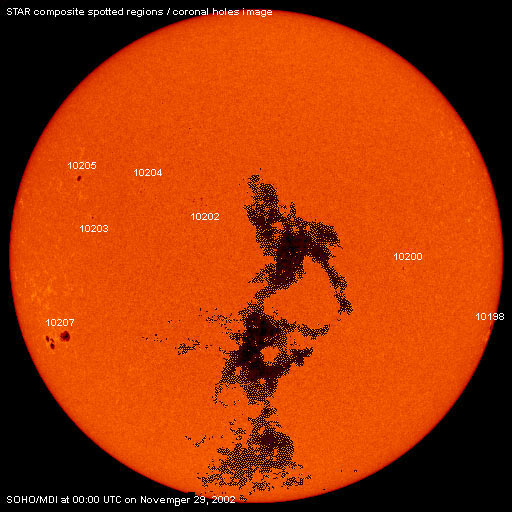
Composite image based on a SOHO/MDI continuum image and overlaid by a coronal hole image. Region numbering has been included.
Data for all numbered solar regions according to the Solar Region Summary provided by SEC/NOAA. Comments are my own, as is the STAR spot count (spots observed at or just prior to midnight) and data for regions not numbered by SEC or where SEC has observed no spots.
| Solar region | Date numbered | SEC spot count |
STAR spot count |
Location at midnight | Area | Classification | Comment |
|---|---|---|---|---|---|---|---|
| 10198 | 2002.11.15 | 10 | 2 | S17W87 | 0270 | EKO | rotating out of view |
| 10200 | 2002.11.20 | 3 | 2 | S03W36 | 0020 | CSO |
classification was AXX at midnight |
| 10202 | 2002.11.24 | 12 | 14 | N14E14 | 0040 | DSO |
classification was BXO at midnight |
| 10203 | 2002.11.26 | 1 | 1 | N09E43 | 0010 | AXX | |
| 10204 | 2002.11.27 | 7 | 6 | N17E28 | 0030 | CSO | |
| 10205 | 2002.11.27 | 1 | 1 | N19E49 | 0040 | HSX | |
| 10206 | 2002.11.27 | 1 | S27E30 | 0000 | AXX | now spotless | |
| 10207 | 2002.11.27 | 9 | 17 | S19E59 | 0430 | EKO | beta-delta |
| Total spot count: | 44 | 43 | |||||
| SSN: | 124 | 113 | |||||
| Month | Average solar flux at Earth |
International sunspot number | Smoothed sunspot number |
|---|---|---|---|
| 2000.04 | 184.2 | 125.5 | 120.8 cycle 23 sunspot max. |
| 2000.07 | 202.3 | 170.1 | 119.8 |
| 2001.10 | 207.6 | 125.5 | 114.0 (-0.1) |
| 2001.11 | 210.6 | 106.5 | 115.5 (+1.5) |
| 2001.12 | 235.1 | 132.2 | 114.6 (-0.9) |
| 2002.01 | 226.6 | 114.1 | 113.5 (-1.1) |
| 2002.02 | 205.0 | 107.4 | 114.7 (+1.2) |
| 2002.03 | 179.5 | 98.4 | 113.4 (-1.3) |
| 2002.04 | 189.8 | 120.7 | 110.5 (-2.9) |
| 2002.05 | 178.4 | 120.8 | (109.0 predicted, -1-5) |
| 2002.06 | 148.7 | 88.3 | (107.0 predicted, -2.0) |
| 2002.07 | 173.5 | 99.9 | (103.6 predicted, -3.4) |
| 2002.08 | 183.6 | 116.4 | (100.2 predicted, -3.4) |
| 2002.09 | 175.8 | 109.3 | (96.4 predicted, -4.8) |
| 2002.10 | 167.0 | 97.5 | (92.3 predicted, -4.1) |
| 2002.11 | 170.5 (1) | 152.3 (2) | (87.0 predicted, -5.3) |
1) Running average based on the daily 20:00 UT observed solar flux value at 2800
MHz.
2) Unofficial, accumulated value based on the Boulder (SEC/NOAA) sunspot number. The official
international sunspot number is typically 25-45% less.
This report has been prepared by Jan Alvestad. It is based partly on my own observations and interpretations, and partly on data from sources noted in solar links. Comments and suggestions are always welcome.
| [DX-Listeners' Club] [DX News] |