
Last update issued on August 19, 2003 at 03:30 UTC.
[Solar and geomagnetic data - last month (updated daily)]
[Solar wind and electron fluence charts (updated daily)]
[Solar cycles 21-23 (last update August 18, 2003)]
[Solar cycles 1-20]
[Graphical comparison of cycles 21, 22 and 23 (last update August 18, 2003)]
[Graphical comparison of cycles 2, 10, 13, 17, 20 and 23 (last update August
18, 2003)]
[Historical solar and geomagnetic data charts 1954-2003 (last update July 23, 2003)]
[Archived reports (last update August 1, 2003)]
The geomagnetic field was at minor to very severe storm levels on August 18. Solar wind speed ranged between 444 and 636 km/sec. The disturbance which began on August 17 intensified strongly early in the day as the interplanetary magnetic field swung strongly to very strongly southwards.
Solar flux measured at 20h UTC on 2.8 GHz was 115.9. The planetary A
index was 86 (STAR Ap - based on the mean of three hour interval ap indices: 89.0).
Three hour interval K indices: 56876655 (planetary), 55775445 (Boulder).
The background x-ray flux is at the class B3 level.
At midnight there were 5 spotted regions on the visible disk. Solar flare activity was low. A total of 4 C class events was recorded during the day.
Region 10431 decayed quickly losing many spots and more than half of its penumbral area. Flares: C2.4
at 09:06, C1.3 at 15:07, C1.1 at 16:05 and C1.4 at 17:42 UTC.
Region 10432 was quiet and stable.
Region 10433 was quiet and stable.
Region 10436 was mostly unchanged and quiet.
Spotted regions not numbered by NOAA/SEC:
[S231] A new region emerged on August 18 in the southwest quadrant. Location at midnight: S21W15.
August 16, 18: No potentially geoeffective CMEs observed.
August 17: A slow partial CME observed off the southern hemisphere limbs and the south pole during the evening was not obviously associated with frontside activity in SOHO EIT or SXI images. This well defined CME probably had a backsided origin.
Coronal hole history (since late October 2002)
Compare today's report with the situation one solar rotation ago: 28
days ago 27 days ago 26 days ago
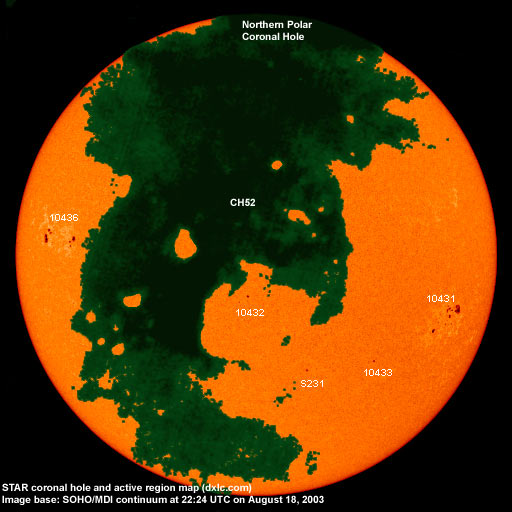
A large coronal hole (CH52) in the northern hemisphere will be in a geoeffective position on August 17-21.
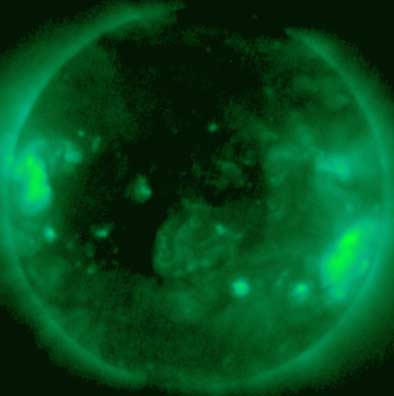
Processed GOES SXI coronal structure image at 22:24 UTC on August 18. Base SXI image courtesy of NOAA/SEC. The darkest areas on the solar disk are likely coronal holes.
The geomagnetic field is expected to be quiet to minor storm on August 19. A high speed stream from coronal hole CH52 will likely arrive on August 20 and cause mostly unsettled to minor storm conditions until August 24.
Long distance low frequency (below 2 MHz) propagation along east-west paths over high and upper middle latitudes is useless. Propagation along north-south paths is poor. [Trans Atlantic propagation conditions are currently monitored every night on 1470 kHz. Dominant station tonight: none, only noted a weak signal from an unidentified station from Brazil.]
| Coronal holes (1) | Coronal mass ejections (2) | M and X class flares (3) |
1) Effects from a coronal hole could reach Earth within the next 5 days.
2) Material from a CME is likely to impact Earth within 96 hours.
3) There is a possibility of either M or X class flares within the next 48 hours.
Green: 0-20% probability, Yellow: 20-60% probability, Red: 60-100% probability.
Compare to the previous day's image.
Data for all numbered solar regions according to the Solar Region Summary provided by NOAA/SEC. Comments are my own, as is the STAR spot count (spots observed at or inside a few hours before midnight) and data for regions not numbered by SEC or where SEC has observed no spots.
| Solar region | Date numbered | SEC spot count |
STAR spot count |
Location at midnight | Area | Classification | Comment |
|---|---|---|---|---|---|---|---|
| 10431 | 2003.08.09 | 40 | 32 | S10W52 | 0180 | EAI | beta-gamma |
| 10432 | 2003.08.13 | 1 | 2 | S02E03 | 0020 | HRX |
classification was CSO at midnight |
| 10433 | 2003.08.14 | 1 | 2 | S20W31 | 0010 | HRX |
classification was HSX at midnight |
| 10434 | 2003.08.15 | S23W33 | plage | ||||
| 10435 | 2003.08.16 | 2 | S17W67 | 0020 | DSO | spotless | |
| 10436 | 2003.08.17 | 10 | 15 | N08E57 | 0160 | EAO | |
| S230 | emerged on 2003.08.17 |
S03W08 | plage | ||||
| S231 | emerged on 2003.08.18 |
5 | S21W15 | 0020 | CSO | ||
| Total spot count: | 54 | 56 | |||||
| SSN: | 104 | 106 | |||||
| Month | Average solar flux at Earth |
International sunspot number | Smoothed sunspot number |
|---|---|---|---|
| 2000.04 | 184.2 | 125.5 | 120.8 cycle 23 sunspot max. |
| 2000.07 | 202.3 | 170.1 | 119.8 |
| 2001.12 | 235.1 | 132.2 | 114.6 (-0.9) |
| 2002.06 | 148.7 | 88.3 | 106.2 (-2.6) |
| 2002.07 | 173.5 | 99.6 | 102.7 (-3.5) |
| 2002.08 | 183.6 | 116.4 | 98.7 (-4.0) |
| 2002.09 | 175.8 | 109.6 | 94.6 (-4.1) |
| 2002.10 | 167.0 | 97.5 | 90.5 (-4.1) |
| 2002.11 | 168.7 | 95.5 | 85.2 (-5.3) |
| 2002.12 | 157.2 | 80.8 | 82.0 (-3.2) |
| 2003.01 | 144.0 | 79.7 | 81.0 (-1.0) |
| 2003.02 | 124.5 | 46.0 | (77.2 predicted, -3.8) |
| 2003.03 | 131.4 | 61.1 | (71.5 predicted, -5.7) |
| 2003.04 | 126.4 | 60.0 | (66.6 predicted, -4.9) |
| 2003.05 | 115.7 | 55.2 | (61.7 predicted, -4.9) |
| 2003.06 | 129.3 | 77.4 | (57.7 predicted, -4.0) |
| 2003.07 | 127.7 | 85.0 | (54.1 predicted, -3.6) |
| 2003.08 | 125.4 (1) | 66.1 (2) | (52.3 predicted, -1.8) |
1) Running average based on the daily 20:00 UTC observed solar flux value at 2800 MHz.
2) Unofficial, accumulated value based on the Boulder (NOAA/SEC) sunspot number. The official international sunspot number is typically
30-50% less.
This report has been prepared by Jan Alvestad. It is based partly on my own observations and analysis, and partly on data from sources noted in solar links. All time references are to the UTC day. Comments and suggestions are always welcome.
| [DX-Listeners' Club] |