
Last major update issued on December 16, 2003 at 03:45 UTC.
[Solar and geomagnetic data - last month (updated daily)]
[Solar wind and electron fluence charts (updated daily)]
[Solar cycles 21-23 (last update December 2, 2003)]
[Solar cycles 1-20]
[Graphical comparison of cycles 21, 22 and 23 (last update December 2, 2003)]
[Graphical comparison of cycles 2, 10, 13, 17, 20 and 23 (last update December
2, 2003)]
[Historical solar and geomagnetic data charts 1954-2003 (last update October 15, 2003)]
[Archived reports (last update December 8, 2003)]
The geomagnetic field was unsettled to minor storm on December 15. Solar wind speed ranged between 606 and 765 km/sec under the influence of a high speed stream from coronal hole CH71.
Solar flux measured at 20h UTC on 2.8 GHz was 100.8. The planetary A
index was 25 (STAR Ap - based on the mean of three hour interval ap indices: 25.8).
Three hour interval K indices: 44454433 (planetary), 54453433 (Boulder).
The background x-ray flux is at the class B2 level.
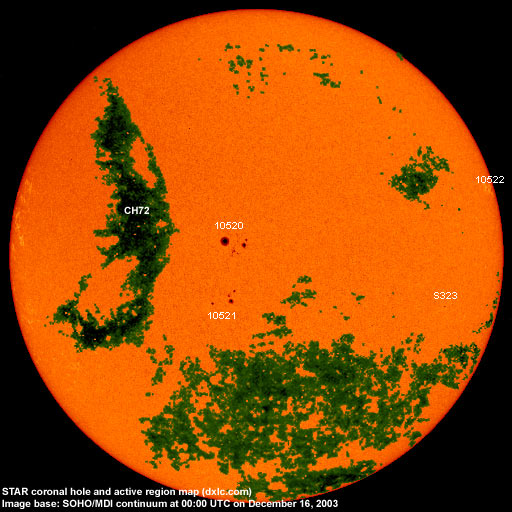
At midnight there were 4 spotted regions on the visible disk. Solar flare activity was low.
Region 10520 developed again in the leading spot section. All negative polarity spots are in the north with the
positive polarity spots being located in the central southern part of the region.
Region 10521 developed as new flux emerged to the north of the leader spot. C flares are possible.
Region 10522 decayed and is rotating over the northwest limb.
Spotted regions not numbered by NOAA/SEC:
[S323] A new region emerged in the southwest quadrant on December 15. Location at midnight: S13W51.
There is some activity at the northeast limb and a spotted region is likely to rotate into view later today.
December 13-15: No partly or fully earth directed CMEs observed.
Coronal hole history (since late October 2002)
Compare today's report with the situation one solar rotation ago: 28
days ago 27 days ago 26 days ago
A recurrent coronal hole in the northern hemisphere (CH72) with a trans equatorial extension will likely rotate into a geoeffective position on December 17-18.

Processed SOHO/EIT 284 image at 19:06 UTC on December 15. The darkest areas on the solar disk are likely coronal holes.
The geomagnetic field is expected to be quiet to unsettled is likely on December 16-19 becoming unsettled to minor storm on December 20-21 with the high speed stream from coronal hole CH72 dominating the solar wind.
Long distance low frequency (below 2 MHz) propagation along east-west paths over high and upper middle latitudes is poor. Propagation along long distance north-south paths is fair to good. [Trans Atlantic propagation conditions are currently monitored every night on 1470 kHz. Dominant station tonight: Radio Cristal del Uruguay with a strong signal. Radio Rafaela (Argentina) and a couple of unidentified stations from Brazil were noted on the main antenna pointing to the southwest. On the antenna to the west Radio Vibraci�n (Venezuela) had a nice and clear signal].
| Coronal holes (1) | Coronal mass ejections (2) | M and X class flares (3) |
1) Effects from a coronal hole could reach Earth within the next 5 days. When the high speed stream has arrived
the color changes to green.
2) Material from a CME is likely to impact Earth within 96 hours.
3) There is a possibility of either M or X class flares within the next 48 hours.
Green: 0-20% probability, Yellow: 20-60% probability, Red: 60-100% probability.
Compare to the previous day's image.
Data for all numbered solar regions according to the Solar Region Summary provided by NOAA/SEC. Comments are my own, as is the STAR spot count (spots observed at or inside a few hours before midnight) and data for regions not numbered by SEC or where SEC has observed no spots. SEC active region numbers in the table below and in the active region map above are the historic SEC/USAF numbers.
| Active region | Date numbered | SEC spot count |
STAR spot count |
Location at midnight | Area | Classification | Comment |
|---|---|---|---|---|---|---|---|
| 10520 | 2003.12.10 | 5 | 18 | N02E06 | 0080 | DSO |
classification was DSI at midnight, area 0130 |
| 10521 | 2003.12.10 | 3 | 10 | S12E09 | 0040 | DSO |
beta-gamma area was 0070 at midnight |
| 10522 | 2003.12.13 | 4 | 3 | N15W76 | 0030 | CSO |
classification was BXO at midnight, area 0010 |
| S322 | emerged on 2003.12.13 |
S15W15 | plage | ||||
| S323 | emerged on 2003.12.15 |
3 | S13W51 | 0010 | CRO | ||
| Total spot count: | 12 | 34 | |||||
| SSN: | 42 | 74 | |||||
| Month | Average solar flux at Earth |
International sunspot number | Smoothed sunspot number |
|---|---|---|---|
| 2000.04 | 184.2 | 125.5 | 120.8 cycle 23 sunspot max. |
| 2000.07 | 202.3 | 170.1 | 119.8 |
| 2001.12 | 235.1 | 132.2 | 114.6 (-0.9) |
| 2002.11 | 168.7 | 95.5 | 85.2 (-5.3) |
| 2002.12 | 157.2 | 80.8 | 82.0 (-3.2) |
| 2003.01 | 144.0 | 79.7 | 80.9 (-1.1) |
| 2003.02 | 124.5 | 46.0 | 78.5 (-2.4) |
| 2003.03 | 131.4 | 61.1 | 74.1 (-4.4) |
| 2003.04 | 126.4 | 60.0 | 70.3 (-3.8) |
| 2003.05 | 115.7 | 55.2 | 67.8 (-2.5) |
| 2003.06 | 129.3 | 77.4 | (65.3 predicted, -2.5) |
| 2003.07 | 127.7 | 85.0 | (61.9 predicted, -3.4) |
| 2003.08 | 122.1 | 72.7 | (59.0 predicted, -2.9) |
| 2003.09 | 112.2 | 48.8 | (57.0 predicted, -2.0) |
| 2003.10 | 151.7 | 65.6 | (54.3 predicted, -2.7) |
| 2003.11 | 140.8 | 67.2 | (51.6 predicted, -2.7) |
| 2003.12 | 104.3 (1) | 33.5 (2) | (49.0 predicted, -2.6) |
1) Running average based on the daily 20:00 UTC observed solar flux value at 2800 MHz.
2) Unofficial, accumulated value based on the Boulder (NOAA/SEC) sunspot number. The official international sunspot number is typically
30-50% less.
This report has been prepared by Jan Alvestad. It is based partly on my own observations and analysis, and partly on data from sources noted in solar links. All time references are to the UTC day. Comments and suggestions are always welcome.
| [DX-Listeners' Club] |