
Last update issued on February 6, 2003 at 03:30 UTC.
[Solar and geomagnetic data
- last 4 weeks (updated daily)]
[Solar wind and electron
fluence charts (updated daily)]
[Solar cycles 21-23 (last
update February 2, 2003)]
[Solar cycles 1-20]
[Graphical comparison of
cycles 21, 22 and 23 (last update February 2, 2003)]
[Graphical comparison of
cycles 10, 13, 17, 20 and 23 (last update February 2, 2003)]
[Historical solar and geomagnetic
data charts 1954-2002 (last update January 27, 2003)]
[Archived reports (last update February 3, 2003)]
The geomagnetic field was quiet to active on February 5. Solar wind speed ranged between 489 and 667 km/sec under the influence of a coronal stream. A new coronal stream arrived early on February 6.
Solar flux measured at 20h UTC on 2.8 GHz was 140.1. The planetary A
index was 12 (STAR Ap - based on the mean of three hour interval ap indices: 12.9).
Three hour interval K indices: 33224422 (planetary), 33222311 (Boulder).
The background x-ray flux is at the class B6 level.
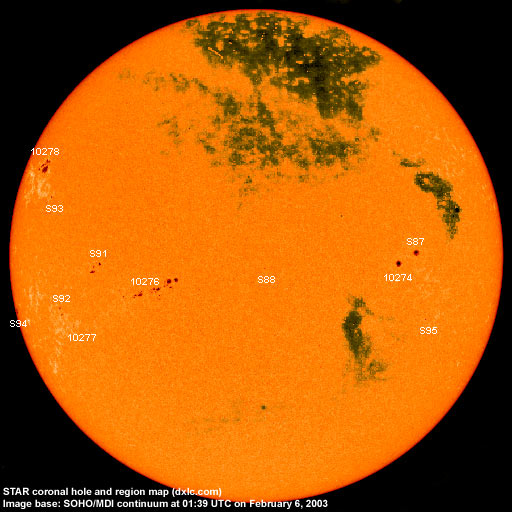
At midnight there were 11 spotted regions on the visible disk, 7 of which have not yet been numbered by SEC/NOAA. Solar flare activity was low. A total of 3 C class events was recorded during the day.
Region 10274 was quiet and stable.
Region 10276 decayed in both the leading and trailing spots sections. The region was quiet.
Region 10277 decayed and became spotless by early afternoon. Just before midnight a single spot reemerged.
Region 10278 was mostly unchanged. The negative and positive polarity areas in the southern part of the region are fairly close and
any development in this area could create a magnetic delta structure. Minor M class flares are possible. Flares:
C1.1 at 19:24, C2.1 at 20:26 and C2.2 at 21:35 UTC.
New region 10279 emerged in the southeast quadrant on February 4 and was numbered the next day. The region decayed and was
spotless before midnight.
Spotted regions not yet numbered by SEC/NOAA:
[S87] A new region emerged north of region 10274 on January 31. Initially it was not clear if this was a separate region
and the spots were associated with region 10274. The region developed quickly on February 2 and it became obvious that regions
10274 and S87 were separate bipolar regions. Slow decay has been observed since February 4. Location at midnight: S04W36.
[S88] A new region emerged in the southeast quadrant on February 4. Location at midnight: S08W01.
[S91] A new region emerged in the southeast quadrant on February 5. The region is developing fairly quickly. Location at
midnight: S09E42.
[S92] A new region emerged in the southeast quadrant between regions 10277 and S90 on February 5. Location at midnight:
S17E56.
[S93] A new region emerged in the northeast quadrant, southwest of region 10278, on February 5. Location at midnight:
N11E59.
[S94] A new region was rotating into view at the southeast limb late in the day. Location at midnight: S17E84.
[S95] A new region emerged in the southwest quadrant. Location at midnight: S17W41.
February 3-5: No obviously geoeffective CMEs observed.
Coronal hole history (since late October 2002)
Compare today's report with the situation one solar rotation ago: 28
days ago 27 days ago 26 days ago
A small coronal hole in the southern hemisphere was in a geoeffective position on February 4.
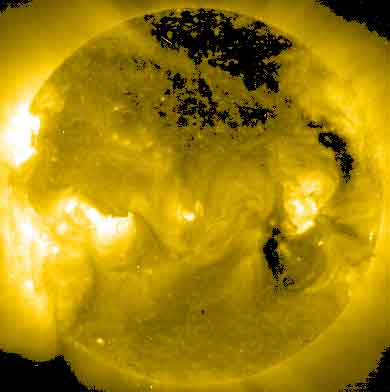
Processed SOHO EIT 284 image at 01:06 UTC on February 6. Any black areas on the solar disk are likely coronal holes.
The geomagnetic field is expected to be quiet to active on February 6-7 due to a coronal stream and quiet to unsettled on February 8-9. Long distance medium wave (AM) band propagation along east-west paths over high and upper middle latitudes is very poor, propagation along north-south paths is good.
| Coronal holes (1) | Coronal mass ejections (2) | M and X class flares (3) |
1) Effects from a coronal hole could reach Earth within the
next 5 days.
2) Material from a CME is likely to impact Earth within 96 hours.
3) There is a possibility of either M or X class flares within the next 48
hours.
Green: 0-20% probability, Yellow: 20-60% probability, Red: 60-100% probability.
Compare to the previous day's image.
Data for all numbered solar regions according to the Solar Region Summary provided by SEC/NOAA. Comments are my own, as is the STAR spot count (spots observed at or inside a few hours before midnight) and data for regions not numbered by SEC or where SEC has observed no spots.
| Solar region | Date numbered | SEC spot count |
STAR spot count |
Location at midnight | Area | Classification | Comment |
|---|---|---|---|---|---|---|---|
| 10274 | 2003.01.28 | 6 | 1 | S07W33 (SEC: S05W37) |
0110 | DSO |
classification was HSX at midnight. location corrected. SEC spot count includes that of region S87 |
| 10276 | 2003.02.01 | 21 | 22 | S13E27 | 0180 | EAI |
beta-gamma classification was FAI at midnight |
| 10277 | 2003.02.04 | 2 | 1 | S20E54 | 0020 | BXO |
classification was AXX at midnight |
| 10278 | 2003.02.04 | 6 | 9 | N19E65 | 0110 | DSO |
classification was DAO at midnight |
| 10279 | 2003.02.05 | 4 | S10E02 | 0010 | BXO |
formerly region S89 now spotless |
|
| S84 | emerged on 2003.01.30 |
N11W74 | plage | ||||
| S85 | emerged on 2003.02.01 |
S13W74 | plage | ||||
| S86 | emerged on 2003.02.02 |
S18W48 | plage | ||||
| S87 | emerged on 2003.01.31 |
1 | S04W38 | 0060 | HSX |
split off from region 10274 |
|
| S88 | emerged on 2003.02.04 |
2 | S08W01 | 0010 | AXX | ||
| S90 | emerged on 2003.02.04 |
S14E54 | now spotless | ||||
| S91 | emerged on 2003.02.05 |
8 | S09E42 | 0060 | DAO | ||
| S92 | emerged on 2003.02.05 |
4 | S17E56 | 0030 | DSO | ||
| S93 | emerged on 2003.02.05 |
2 | N11E59 | 0020 | HRX | ||
| S94 | emerged on 2003.02.05 |
2 | S17E84 | 0060 | HAX | ||
| S95 | emerged on 2003.02.05 |
1 | S17W41 | 0010 | AXX | ||
| Total spot count: | 39 | 53 | |||||
| SSN: | 89 | 163 | |||||
| Month | Average solar flux at Earth |
International sunspot number | Smoothed sunspot number |
|---|---|---|---|
| 2000.04 | 184.2 | 125.5 | 120.8 cycle 23 sunspot max. |
| 2000.07 | 202.3 | 170.1 | 119.8 |
| 2001.12 | 235.1 | 132.2 | 114.6 (-0.9) |
| 2002.01 | 226.6 | 114.1 | 113.5 (-1.1) |
| 2002.02 | 205.0 | 107.4 | 114.6 (+1.2) |
| 2002.03 | 179.5 | 98.4 | 113.3 (-1.3) |
| 2002.04 | 189.8 | 120.7 | 110.5 (-2.9) |
| 2002.05 | 178.4 | 120.8 | 108.8 (-1.7) |
| 2002.06 | 148.7 | 88.3 | 106.2 (-2.6) |
| 2002.07 | 173.5 | 99.6 | 102.7 (-3.5) |
| 2002.08 | 183.6 | 116.4 | (99.7 predicted, -3.0) |
| 2002.09 | 175.8 | 109.6 | (96.7 predicted, -3.0) |
| 2002.10 | 167.0 | 97.5 | (93.2 predicted, -3.5) |
| 2002.11 | 168.7 | 95.0 | (88.0 predicted, -5.2) |
| 2002.12 | 157.2 | 81.6 | (83.6 predicted, -4.4) |
| 2003.01 | 144.0 | 79.5 | (80.6 predicted, -3.0) |
| 2003.02 | 132.0 (1) | 13.3 (2) | (75.5 predicted, -5.1) |
1) Running average based on the daily 20:00 UT observed solar flux value at 2800
MHz.
2) Unofficial, accumulated value based on the Boulder (SEC/NOAA) sunspot number. The official
international sunspot number is typically 25-45% less.
This report has been prepared by Jan Alvestad. It is based partly on my own observations and interpretations, and partly on data from sources noted in solar links. All time references are to the UTC day. Comments and suggestions are always welcome.
| [DX-Listeners' Club] |