
Last update issued on February 14, 2003 at 08:00 UTC (text only). Images updated at 16:10 UTC.
[Solar and geomagnetic data
- last 4 weeks (updated daily)]
[Solar wind and electron
fluence charts (updated daily)]
[Solar cycles 21-23 (last
update February 2, 2003)]
[Solar cycles 1-20]
[Graphical comparison of
cycles 21, 22 and 23 (last update February 2, 2003)]
[Graphical comparison of
cycles 10, 13, 17, 20 and 23 (last update February 2, 2003)]
[Historical solar and geomagnetic
data charts 1954-2002 (last update January 27, 2003)]
[Archived reports (last update February 10, 2003)]
The geomagnetic field was quiet to unsettled on February 13. Solar wind speed ranged between 350 and 414 km/sec. A weak disturbance was in progress most of the day. Even with the interplanetary magnetic field being moderately southwards at times, this didn't cause any increase in geomagnetic activity. During the first hours of February 14 a coronal stream has begun influencing the geomagnetic field causing unsettled to active conditions.
Solar flux measured at 20h UTC on 2.8 GHz was 130.6. The planetary A
index was 8 (STAR Ap - based on the mean of three hour interval ap indices: 8.8).
Three hour interval K indices: 22123323 (planetary), 21212223 (Boulder).
The background x-ray flux is at the class B5 level.
At midnight there were 9 spotted regions on the visible disk, 3 of which have not yet been numbered by SEC/NOAA. Solar flare activity was low. A total of 2 C class events was recorded during the day, including a C2.2 event from spotless region 10284 near the northwest limb. This region has been quite active early on February 14 as well.
Region 10276 developed significantly but remained mostly quiet. The region may be capable of producing an M class event while at the west limb.
Region 10278 decayed slowly and quietly.
Region 10281 decayed slowly and quietly.
Region 10282 developed slowly and could produce further C class flares. Flare: C1.8 at 05:02.
Region 10283 decayed slowly and could soon become spotless.
Region 10285 decayed slowly and quietly.
Spotted regions not yet numbered by SEC/NOAA:
[S98] A new region emerged in the northwest quadrant: Location at midnight: N04W42.
[S99] A new region emerged in the northwest quadrant: Location at midnight: N12W35.
[S100] A new region emerged in the northeast quadrant: Location at midnight: N11E35.
February 11-13: No obviously geoeffective CMEs observed.
Coronal hole history (since late October 2002)
Compare today's report with the situation one solar rotation ago: 28
days ago 27 days ago 26 days ago
A trans equatorial coronal hole and a southern polar coronal hole extension will rotate into a geoeffective position on February 12-18.
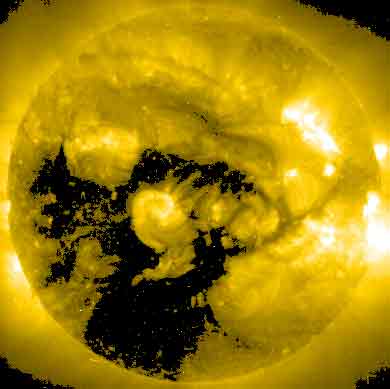
Processed SOHO EIT 284 image at 01:06 UTC on February 14. Any black areas on the solar disk are likely coronal holes.
The geomagnetic field is expected to be unsettled to minor storm until February 21. Long distance medium wave (AM) band propagation along east-west paths over high and upper middle latitudes is very poor, propagation along north-south paths is fairi to good.
| Coronal holes (1) | Coronal mass ejections (2) | M and X class flares (3) |
1) Effects from a coronal hole could reach Earth within the
next 5 days.
2) Material from a CME is likely to impact Earth within 96 hours.
3) There is a possibility of either M or X class flares within the next 48
hours.
Green: 0-20% probability, Yellow: 20-60% probability, Red: 60-100% probability.
Compare to the previous day's image.
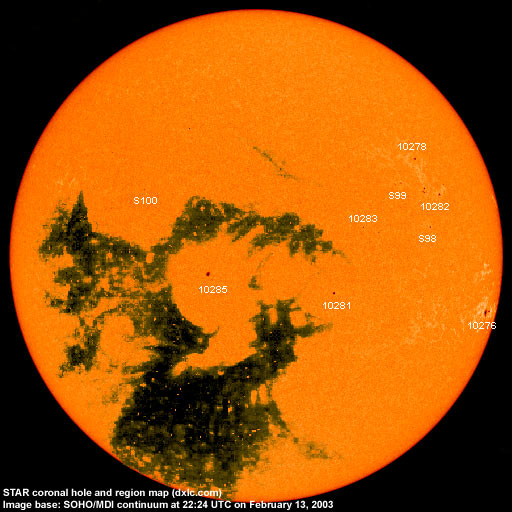
Data for all numbered solar regions according to the Solar Region Summary provided by SEC/NOAA. Comments are my own, as is the STAR spot count (spots observed at or inside a few hours before midnight) and data for regions not numbered by SEC or where SEC has observed no spots.
| Solar region | Date numbered | SEC spot count |
STAR spot count |
Location at midnight | Area | Classification | Comment |
|---|---|---|---|---|---|---|---|
| 10276 | 2003.02.01 | 5 | 6 | S14W77 | 0070 | CAO |
classification was DAO at midnight, area 0150 |
| 10277 | 2003.02.04 | 5 | S18W47 | 0020 | BXO | now spotless | |
| 10278 | 2003.02.04 | 1 | 1 | N18W42 | 0020 | HSX | |
| 10280 | 2003.02.06 | 4 | S06W68 | 0040 | CSO | now spotless | |
| 10281 | 2003.02.06 | 1 | 1 | S15W19 | 0010 | HSX | |
| 10282 | 2003.02.07 | 11 | 7 | N10W45 | 0050 | DSO | |
| 10283 | 2003.02.07 | 3 | 1 | N00W26 | 0010 | AXX | |
| 10284 | 2003.02.08 | N12W84 | plage | ||||
| 10285 | 2003.02.08 | 3 | 3 | S11E12 | 0030 | CAO |
classification was HAX at midnight |
| 10286 | 2003.02.09 | S13W71 | plage | ||||
| S90 | emerged on 2003.02.04 |
S13W45 | now spotless | ||||
| S96 | emerged on 2003.02.06 |
S03W86 | plage | ||||
| S98 | emerged on 2003.02.13 |
3 | N04W42 | 0020 | CRO | ||
| S99 | emerged on 2003.02.13 |
3 | N12W45 | 0020 | CRO | ||
| S100 | emerged on 2003.02.13 |
2 | N11E35 | 0000 | AXX | ||
| Total spot count: | 33 | 27 | |||||
| SSN: | 113 | 117 | |||||
| Month | Average solar flux at Earth |
International sunspot number | Smoothed sunspot number |
|---|---|---|---|
| 2000.04 | 184.2 | 125.5 | 120.8 cycle 23 sunspot max. |
| 2000.07 | 202.3 | 170.1 | 119.8 |
| 2001.12 | 235.1 | 132.2 | 114.6 (-0.9) |
| 2002.01 | 226.6 | 114.1 | 113.5 (-1.1) |
| 2002.02 | 205.0 | 107.4 | 114.6 (+1.2) |
| 2002.03 | 179.5 | 98.4 | 113.3 (-1.3) |
| 2002.04 | 189.8 | 120.7 | 110.5 (-2.9) |
| 2002.05 | 178.4 | 120.8 | 108.8 (-1.7) |
| 2002.06 | 148.7 | 88.3 | 106.2 (-2.6) |
| 2002.07 | 173.5 | 99.6 | 102.7 (-3.5) |
| 2002.08 | 183.6 | 116.4 | (99.7 predicted, -3.0) |
| 2002.09 | 175.8 | 109.6 | (96.7 predicted, -3.0) |
| 2002.10 | 167.0 | 97.5 | (93.2 predicted, -3.5) |
| 2002.11 | 168.7 | 95.0 | (88.0 predicted, -5.2) |
| 2002.12 | 157.2 | 81.6 | (83.6 predicted, -4.4) |
| 2003.01 | 144.0 | 79.5 | (80.6 predicted, -3.0) |
| 2003.02 | 136.3 (1) | 55.0 (2) | (75.5 predicted, -5.1) |
1) Running average based on the daily 20:00 UT observed solar flux value at 2800
MHz.
2) Unofficial, accumulated value based on the Boulder (SEC/NOAA) sunspot number. The official
international sunspot number is typically 25-45% less.
This report has been prepared by Jan Alvestad. It is based partly on my own observations and interpretations, and partly on data from sources noted in solar links. All time references are to the UTC day. Comments and suggestions are always welcome.
| [DX-Listeners' Club] |