
Last update January 4, 2003 at 03:00 UTC.
[Solar and geomagnetic data
- last 4 weeks (updated daily)]
[Solar wind and electron
fluence charts (updated daily)]
[Solar cycles 21-23 (last
update January 1, 2003)]
[Solar cycles 1-20]
[Graphical comparison of
cycles 21, 22 and 23 (last update January 1, 2003)]
[Graphical comparison of
cycles 10, 13, 17, 20 and 23 (last update January 1, 2003)]
[Historical solar and geomagnetic
data charts 1954-2002 (last update October 13, 2002)]
[Archived reports (last update January 1, 2003)]
The geomagnetic field was quiet to active on January 3. Solar wind speed ranged between 357 and 610 km/sec under the influence of a coronal stream.
Solar flux measured at 20h UTC on 2.8 GHz was 137.6. The planetary A
index was 13 (STAR Ap - based on the mean of three hour interval ap indices: 14.3).
Three hour interval K indices: 22223434 (planetary), 22223533 (Boulder).
The background x-ray flux is at the class B4 level.
At midnight there were 7 spotted regions on the visible disk. Solar flare activity was low. A filament eruption stretching from region 10234 and northwards was the source of a C2.0 event peaking at 14:45 UTC.
Region 10234 decayed further and is likely to become spotless early on Jan.4.
Region 10239 decayed significantly losing all but two spots.
Region 10241 developed early in the day, then decayed slowly.
Region 10242 developed quickly and could be capable of producing a minor M class flare. Flare:
C1.0 at 04:52 UTC.
New region 10243 emerged in the southwest quadrant on January 1 and was numbered two days later. The region is developing
quickly and has minor M class flare potential. Flares: C1.9 at 19:38, C2.0 at 20:50 and C3.3
at 22:44 UTC.
New region 10244 emerged quickly in the southeast quadrant south of region 10242. A minor M class flare is becoming a
possibility. Flares: C1.8 at 21:11 and C4.7 at 22:00 UTC.
New region 10245 rotated into view at the northeast limb. The single spot has more than doubled its size since early in the
day. Further development is likely.
January 1-3: No obviously geoeffective CMEs observed. At least two CMEs were observed off of the west limb on January 3 with one of them associated with an erupting filament.
Coronal hole history (since late October 2002)
Compare today's report with the situation one solar rotation ago: 28
days ago
27 days ago 26 days ago
A recurrent trans equatorial coronal hole will rotate into a geoeffective position on January 6-7.
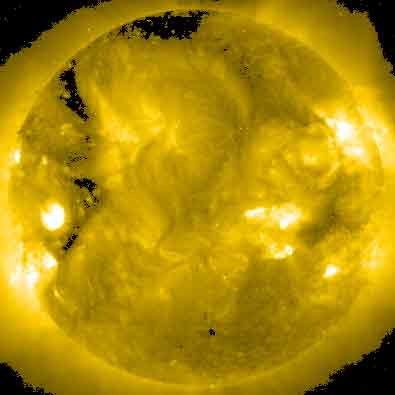
Processed SOHO EIT 284 image at 19:06 UTC on January 3. Any black areas on the solar disk are likely coronal holes.
The geomagnetic field is expected to be unsettled to active on January 4, possibly with an isolated minor storm interval, due to a coronal stream. Quiet to unsettled is likely on January 5-7. Long distance medium wave (AM) band propagation along east-west paths over high and upper middle latitudes is poor to very poor.
| Coronal holes (1) | Coronal mass ejections (2) | M and X class flares (3) |
1) Effects from a coronal hole could reach Earth within the
next 5 days.
2) Material from a CME is likely to impact Earth within 96 hours.
3) There is a possibility of either M or X class flares within the next 48
hours.
Green: 0-20% probability, Yellow: 20-60% probability, Red: 60-100% probability.
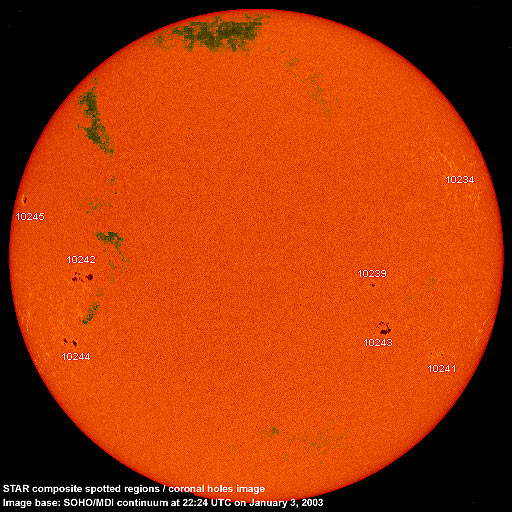
Composite image based on a SOHO/MDI continuum image and overlaid by a coronal hole image. Region numbering has been included. Compare to the previous day's image.
Data for all numbered solar regions according to the Solar Region Summary provided by SEC/NOAA. Comments are my own, as is the STAR spot count (spots observed at or inside a few hours before midnight) and data for regions not numbered by SEC or where SEC has observed no spots.
| Solar region | Date numbered | SEC spot count |
STAR spot count |
Location at midnight | Area | Classification | Comment |
|---|---|---|---|---|---|---|---|
| 10234 | 2002.12.24 | 1 | 1 | N19W60 | 0010 | AXX | |
| 10235 | 2002.12.25 | N14W89 | plage | ||||
| 10237 | 2002.12.28 | S26W78 | plage | ||||
| 10238 | 2002.12.28 | N09W63 | plage | ||||
| 10239 | 2002.12.29 | 5 | 2 | S09W30 | 0040 | CAO |
classification was HAX at midnight, area 0030 |
| 10240 | 2002.12.30 | S08W17 | plage | ||||
| 10241 | 2003.01.02 | 2 | 3 | S24W53 | 0020 | HRX |
classification was DRO at midnight |
| 10242 | 2003.01.02 | 15 | 17 | S08E48 | 0090 | DAI |
area was 0200 at midnight |
| 10243 | 2003.01.03 | 5 | 15 | S19W34 | 0050 | DAO |
formerly region S65 classification was DAI at midnight, area 0180 |
| 10244 | 2003.01.03 | 9 | 8 | S15E58 | 0050 | DAO |
area was 0130 at midnight |
| 10245 | 2003.01.03 | 1 | 1 | N12E74 | 0070 | HAX |
area was 0110 at midnight |
| S63 | emerged on 2002.12.29 |
S15W80 | plage | ||||
| Total spot count: | 38 | 47 | |||||
| SSN: | 108 | 117 | |||||
| Month | Average solar flux at Earth |
International sunspot number | Smoothed sunspot number |
|---|---|---|---|
| 2000.04 | 184.2 | 125.5 | 120.8 cycle 23 sunspot max. |
| 2000.07 | 202.3 | 170.1 | 119.8 |
| 2001.12 | 235.1 | 132.2 | 114.6 (-0.9) |
| 2002.01 | 226.6 | 114.1 | 113.5 (-1.1) |
| 2002.02 | 205.0 | 107.4 | 114.6 (+1.2) |
| 2002.03 | 179.5 | 98.4 | 113.3 (-1.3) |
| 2002.04 | 189.8 | 120.7 | 110.5 (-2.9) |
| 2002.05 | 178.4 | 120.8 | 108.8 (-1.7) |
| 2002.06 | 148.7 | 88.3 | 106.2 (-2.6) |
| 2002.07 | 173.5 | 99.6 | (102.1 predicted, -4.1) |
| 2002.08 | 183.6 | 116.4 | (98.5 predicted, -3.6) |
| 2002.09 | 175.8 | 109.6 | (95.5 predicted, -3.0) |
| 2002.10 | 167.0 | 97.5 | (92.0 predicted, -3.5) |
| 2002.11 | 168.7 | 95.0 | (86.7 predicted, -5.3) |
| 2002.12 | 157.2 | 81.6 | (82.4 predicted, -4.3) |
| 2003.01 | 123.6 (1) | 7.4 (2) | (79.4 predicted, -3.0) |
1) Running average based on the daily 20:00 UT observed solar flux value at 2800
MHz.
2) Unofficial, accumulated value based on the Boulder (SEC/NOAA) sunspot number. The official
international sunspot number is typically 25-45% less.
This report has been prepared by Jan Alvestad. It is based partly on my own observations and interpretations, and partly on data from sources noted in solar links. Comments and suggestions are always welcome.
| [DX-Listeners' Club] |