
Last update issued on June 2, 2003 at 04:00 UTC. Minor update posted at 11:51 UTC.
[Solar and geomagnetic data - last 4 weeks (updated daily)]
[Solar wind and electron fluence charts (updated daily)]
[Solar cycles 21-23 (last update May 1, 2003)]
[Solar cycles 1-20]
[Graphical comparison of cycles 21, 22 and 23 (last update May 1, 2003)]
[Graphical comparison of cycles 10, 13, 17, 20 and 23 (last update May 1, 2003)]
[Historical solar and geomagnetic data charts 1954-2003 (last update April 13, 2003)]
[Archived reports (last update June 1, 2003)]
The geomagnetic field was quiet to active on June 1. Solar wind speed ranged between 560 and 708 km/sec. A high speed stream from coronal hole CH42 arrived early in the day and strengthened gradually.
Solar flux measured at 20h UTC on 2.8 GHz was 112.3. The planetary A
index was 19 (STAR Ap - based on the mean of three hour interval ap indices: 19.5).
Three hour interval K indices: 34323344 (planetary), 24333344 (Boulder).
The background x-ray flux is at the class C1 level.
At midnight there were 4 spotted regions on the visible disk. Solar flare activity was high. A total of 10 C and 5 M class events was recorded during the day.
Region 10368 decayed slowly and could become spotless today.
Region 10373 developed slowly with new spots emerging in the southern part of the region. Flare:
C1.2 at 11:54 UTC.
New region 10375 rotated into view at the northeast limb and has M class flare potential. There may be a magnetic delta
structure in the main penumbra but the region will have to rotate into better view to confirm this. Flares:
C3.7 at 00:51, M1.4 long duration event peaking at 03:06, M1.0 at 07:11, C4.6 at 07:49, C3.1 at 10:00, M1.0 at 12:50, C1.9 at
14:34, C1.2 at 18:41, C1.7 at 19:37 and M1.0 at 21:05 UTC.
Spotted regions not numbered or misnumbered by NOAA/SEC:
[S169] This region emerged very quickly after noon on May 24 in the southeast quadrant about 11 degrees longitude east of
spotless region 10365. The region continued to develop quickly as a compact region on May 25-28. On May 29 - June 1 the region decayed
slowly losing penumbral area and spots. Another major flare is possible while the region is behind the southwest limb on June
2 and 3. Location at midnight: S07W85. Flares: C5.0 at 09:03, M1.4 at 16:52, C2.0 at 20:33 and
C9.1 at 23:37 UTC. This region was the source of a major M7.0 flare at 00:22 on June 2.
Comment added at 11:51 UTC on June 2: Region S169, now fully behind the southwest limb, produced an M4.0 flare at 08:36 UTC. A new region has emerged quickly in the southeast quadrant and is currently located at S12E20. The region is classificed as DAO with the leader spot being assymetrical and having penumbra.
The geomagnetic field has been at active to major storm levels during the first half of the day with the planetary A index reaching 77 during the 06-09h UTC interval.
May 30: No obviously geoeffective CMEs observed.
May 31: A halo CME was observed in LASCO C2 images after the M9 flare in region S169 early in the day. This CME could reach Earth on June 2. As a high speed stream is dominating the solar wind, it is uncertain how much, if anything, the CME will add to the current geomagnetic disturbance.
June 1: Several CMEs were observed during the day, all of them appeared to be the result of activity in limb regions S169 and 10375.
Coronal hole history (since late October 2002)
Compare today's report with the situation one solar rotation ago: 28
days ago 27 days ago 26
days ago
A huge recurrent coronal hole (CH42) in the southern hemisphere will rotate into a geoeffective position on May 29-June 6. This coronal hole has a narrow leading extension into the northern hemisphere.
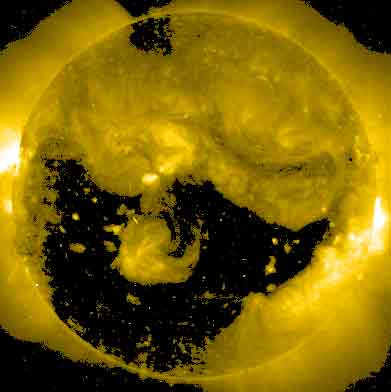
Processed SOHO EIT 284 image at 19:06 UTC on June 1. Any black areas on the solar disk are likely coronal holes.
The geomagnetic field is expected to be unsettled to minor storm until June 9 due to a high speed stream from coronal hole CH42.
Long distance medium wave (AM) band propagation along east-west paths over high and upper middle latitudes is useless and will likely be very poor to useless until at least June 10. Propagation along north-south paths is poor. [Trans Atlantic propagation conditions are currently monitored every night on 1470 kHz. Dominant station tonight: Radio Cristal del Uruguay.]
| Coronal holes (1) | Coronal mass ejections (2) | M and X class flares (3) |
1) Effects from a coronal hole could reach Earth within the next 5 days.
2) Material from a CME is likely to impact Earth within 96 hours.
3) There is a possibility of either M or X class flares within the next 48 hours.
Green: 0-20% probability, Yellow: 20-60% probability, Red: 60-100% probability.

Compare to the previous day's image.
Data for all numbered solar regions according to the Solar Region Summary provided by NOAA/SEC. Comments are my own, as is the STAR spot count (spots observed at or inside a few hours before midnight) and data for regions not numbered by SEC or where SEC has observed no spots.
| Solar region | Date numbered | SEC spot count |
STAR spot count |
Location at midnight | Area | Classification | Comment |
|---|---|---|---|---|---|---|---|
| 10365 | 2003.05.20 | 15 | S08W93 (SEC: S07W84) |
0450 | DKC |
location corrected the region is spotless, SECs spots belong to region S169. |
|
| 10366 | 2003.05.22 | N11W68 | plage | ||||
| 10367 | 2003.05.22 | S14W61 | plage | ||||
| 10368 | 2003.05.22 | 2 | 1 | S33W51 | 0010 | AXX |
classification was HSX at midnight |
| 10370 | 2003.05.23 | N16W65 | plage | ||||
| 10371 | 2003.05.27 | S13W75 | plage | ||||
| 10372 | 2003.05.27 | S14W68 | plage | ||||
| 10373 | 2003.05.27 | 7 | 11 | N07E15 | 0120 | CSO |
classification was DSO at midnight |
| 10375 | 2003.06.01 | 2 | 6 | N11E74 | 0140 | DAO | |
| S169 | emerged on 2003.05.24 |
4 | S07W85 | 0200 | CAO |
most of the region had rotated out of view |
|
| S171 | emerged on 2003.05.28 |
S23W50 | plage | ||||
| S172 | emerged on 2003.05.28 |
S17W31 | plage | ||||
| S173 | emerged on 2003.05.28 |
N05W08 | plage | ||||
| S174 | emerged on 2003.05.30 |
N18W27 | plage | ||||
| S175 | emerged on 2003.05.31 |
N14E02 | plage | ||||
| Total spot count: | 26 | 22 | |||||
| SSN: | 66 | 62 | |||||
| Month | Average solar flux at Earth |
International sunspot number | Smoothed sunspot number |
|---|---|---|---|
| 2000.04 | 184.2 | 125.5 | 120.8 cycle 23 sunspot max. |
| 2000.07 | 202.3 | 170.1 | 119.8 |
| 2001.12 | 235.1 | 132.2 | 114.6 (-0.9) |
| 2002.05 | 178.4 | 120.8 | 108.8 (-1.7) |
| 2002.06 | 148.7 | 88.3 | 106.2 (-2.6) |
| 2002.07 | 173.5 | 99.6 | 102.7 (-3.5) |
| 2002.08 | 183.6 | 116.4 | 98.7 (-4.0) |
| 2002.09 | 175.8 | 109.6 | 94.6 (-4.1) |
| 2002.10 | 167.0 | 97.5 | 90.5 (-4.1) |
| 2002.11 | 168.7 | 95.5 | 85.2 (-5.3) |
| 2002.12 | 157.2 | 80.8 | (81.4 predicted, -3.8) |
| 2003.01 | 144.0 | 79.5 | (78.3 predicted, -3.1) |
| 2003.02 | 124.5 | 46.2 | (73.3 predicted, -5.0) |
| 2003.03 | 131.4 | 61.5 | (67.6 predicted, -5.7) |
| 2003.04 | 126.4 | 60.0 | (62.7 predicted, -4.9) |
| 2003.05 | 115.7 | 55.2 | (57.8 predicted, -4.9) |
| 2003.06 | 112.3 (1) | 2.2 (2) | (53.8 predicted, -4.0) |
1) Running average based on the daily 20:00 UTC observed solar flux value at 2800 MHz.
2) Unofficial, accumulated value based on the Boulder (NOAA/SEC) sunspot number. The official international sunspot number is typically
30-50% less.
This report has been prepared by Jan Alvestad. It is based partly on my own observations and interpretations, and partly on data from sources noted in solar links. All time references are to the UTC day. Comments and suggestions are always welcome.
| [DX-Listeners' Club] |