
Last update issued on March 31, 2003 at 03:05 UTC.
[Solar and geomagnetic data - last 4 weeks (updated daily)]
[Solar wind and electron fluence charts (updated daily)]
[Solar cycles 21-23 (last update March 3, 2003)]
[Solar cycles 1-20]
[Graphical comparison of cycles 21, 22 and 23 (last update March 3, 2003)]
[Graphical comparison of cycles 10, 13, 17, 20 and 23 (last update March 3, 2003)]
[Historical solar and geomagnetic data charts 1954-2002 (last update January 27, 2003)]
[Archived reports (last update March 24, 2003)]
The geomagnetic field was unsettled to minor storm on March 30. Solar wind speed ranged between 425 and 663 km/sec under the influence of a high speed stream from coronal hole CH27.
Solar flux measured at 20h UTC on 2.8 GHz was 154.5. The planetary A
index was 26 (STAR Ap - based on the mean of three hour interval ap indices: 26.8).
Three hour interval K indices: 45333345 (planetary), 44334434 (Boulder).
The background x-ray flux is at the class B4 level.
At midnight there were 9 spotted regions on the visible disk, 1 of the regions has not yet been numbered by SE/NOAA. Solar flare activity was low. A total of 3 C class events was recorded during the day.
Region 10318 decayed and lost several spots.
Region 10319 decayed further and appears to be losing all trailing spots.
Region 10320 developed slowly and quietly and will soon rotate over the northwest limb.
Region 10321 decayed slowly and was mostly quiet. Flare: C1.3 long duration event
peaking at 18:07 UTC.
Region 10323 lost some intermediate spots while gaining penumbral area in the largest leading and trailing spots. The
region has simplified and has only a minor chance of generating an M class flare. Flares: C3.6
at 01:25 and C1.1 at 01:59 UTC.
Region 10324 decayed slowly and quietly.
Region 10325 developed slowly as negative polarity areas emerged to the southwest of the large penumbra.
Region 10326 was unchanged and quiet.
Spotted regions not yet numbered by SEC/NOAA:
[S129] A new region emerged northwest of region 10324 in the southeast quadrant on March 30. Location at midnight: S11E19.
March 28-30: No obviously geoeffective CMEs observed.
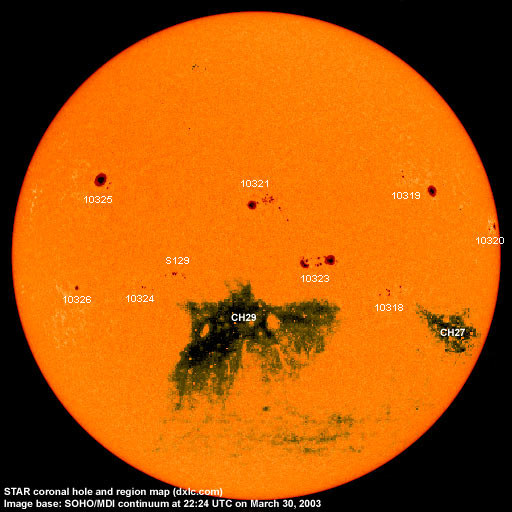
Coronal hole history (since late October 2002)
Compare today's report with the situation one solar rotation ago: 28
days ago 27 days ago 26
days ago
A coronal hole (CH27) in the southern hemisphere was in a geoeffective position on March 25-27. A small coronal hole (CH28) in the northern hemisphere was in a geoeffective position on March 28 and closed on March 29-30. A coronal hole (CH29) in the southern hemisphere was in a geoeffective position on March 30-31.
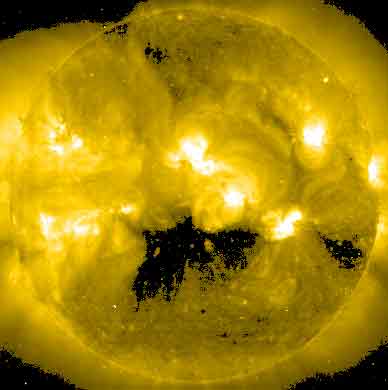
Processed SOHO EIT 284 image at 19:06 UTC on March 30. Any black areas on the solar disk are likely coronal holes.
The geomagnetic field is expected to be quiet to minor storm until April 2 due to high speed streams from coronal holes CH27, CH28 and CH29. Long distance medium wave (AM) band propagation along east-west paths over high and upper middle latitudes is very poor, propagation along north-south paths is fair. [Trans Atlantic propagation conditions are currently monitored every night on 1470 kHz. Dominant station tonight: R�dio Morro Verde, Mairi (Brazil) before 02h UTC, then Radio Rafaela (Argentina). At 05:30 UTC on March 30 R�dio Mensagem, Jacarei (Brazil) was noted.]
| Coronal holes (1) | Coronal mass ejections (2) | M and X class flares (3) |
1) Effects from a coronal hole could reach Earth within the next 5 days.
2) Material from a CME is likely to impact Earth within 96 hours.
3) There is a possibility of either M or X class flares within the next 48 hours.
Green: 0-20% probability, Yellow: 20-60% probability, Red: 60-100% probability.
Compare to the previous day's image.
Data for all numbered solar regions according to the Solar Region Summary provided by SEC/NOAA. Comments are my own, as is the STAR spot count (spots observed at or inside a few hours before midnight) and data for regions not numbered by SEC or where SEC has observed no spots.
| Solar region | Date numbered | SEC spot count |
STAR spot count |
Location at midnight | Area | Classification | Comment |
|---|---|---|---|---|---|---|---|
| 10318 | 2003.03.22 | 14 | 10 | S13W34 | 0060 | DAI |
beta-gamma classification was DSO at midnight, area 0040 |
| 10319 | 2003.03.23 | 11 | 6 | N13W42 | 0250 | EAO |
classification was DAO at midnight, area 0160 |
| 10320 | 2003.03.24 | 4 | 4 | N06W74 | 0100 | CAO |
classification was DAO at midnight, area 0080 |
| 10321 | 2003.03.24 | 25 | 22 | N05E03 | 0210 | EHI |
beta-gamma classification was DAI at midnight |
| 10323 | 2003.03.25 | 24 | 28 | S08W15 | 0230 | DAI | beta-gamma |
| 10324 | 2003.03.27 | 11 | 4 | S15E27 (SEC: S13E23) |
0050 | ESO |
classification was HRX at midnight, area 0020 only negative polarity spots. location corrected, SEC has mistakenly included the spots from new region S129 |
| 10325 | 2003.03.27 | 5 | 5 | N13E40 | 0320 | HKX |
beta-gamma classification was DKO at midnight |
| 10326 | 2003.03.28 | 2 | 2 | S13E49 | 0050 | HSX | |
| S126 | emerged on 2003.03.24 |
S08W86 | now spotless | ||||
| S127 | emerged on 2003.03.24 |
S17W89 | plage | ||||
| S129 | emerged on 2003.03.30 |
9 | S11E19 | 0040 | CAO | ||
| Total spot count: | 96 | 90 | |||||
| SSN: | 176 | 180 | |||||
| Month | Average solar flux at Earth |
International sunspot number | Smoothed sunspot number |
|---|---|---|---|
| 2000.04 | 184.2 | 125.5 | 120.8 cycle 23 sunspot max. |
| 2000.07 | 202.3 | 170.1 | 119.8 |
| 2001.12 | 235.1 | 132.2 | 114.6 (-0.9) |
| 2002.02 | 205.0 | 107.4 | 114.6 (+1.2) |
| 2002.03 | 179.5 | 98.4 | 113.3 (-1.3) |
| 2002.04 | 189.8 | 120.7 | 110.5 (-2.9) |
| 2002.05 | 178.4 | 120.8 | 108.8 (-1.7) |
| 2002.06 | 148.7 | 88.3 | 106.2 (-2.6) |
| 2002.07 | 173.5 | 99.6 | 102.7 (-3.5) |
| 2002.08 | 183.6 | 116.4 | 98.7 (-4.0) |
| 2002.09 | 175.8 | 109.6 | (94.7 predicted, -4.0) |
| 2002.10 | 167.0 | 97.5 | (91.2 predicted, -3.5) |
| 2002.11 | 168.7 | 95.0 | (86.0 predicted, -5.2) |
| 2002.12 | 157.2 | 81.6 | (81.6 predicted, -4.4) |
| 2003.01 | 144.0 | 79.5 | (78.6 predicted, -3.0) |
| 2003.02 | 124.5 | 46.2 | (73.6 predicted, -5.0) |
| 2003.03 | 130.5 (1) | 114.0 (2) | (67.9 predicted, -5.7) |
1) Running average based on the daily 20:00 UTC observed solar flux value at 2800 MHz.
2) Unofficial, accumulated value based on the Boulder (SEC/NOAA) sunspot number. The official international sunspot number is typically 25-45% less.
This report has been prepared by Jan Alvestad. It is based partly on my own observations and interpretations, and partly on data from sources noted in solar links. All time references are to the UTC day. Comments and suggestions are always welcome.
| [DX-Listeners' Club] |