
Last update issued on May 10, 2003 at 04:10 UTC.
[Solar and geomagnetic data - last 4 weeks (updated daily)]
[Solar wind and electron fluence charts (updated daily)]
[Solar cycles 21-23 (last update May 1, 2003)]
[Solar cycles 1-20]
[Graphical comparison of cycles 21, 22 and 23 (last update May 1, 2003)]
[Graphical comparison of cycles 10, 13, 17, 20 and 23 (last update May 1, 2003)]
[Historical solar and geomagnetic data charts 1954-2003 (last update April 13, 2003)]
[Archived reports (last update May 5, 2003)]
The geomagnetic field was unsettled to minor storm on May 9. Solar wind speed ranged between 665 and 986 km/sec. Early in the day a high speed stream from coronal hole CH38 dominated the solar wind, then, at 04:49 UTC at SOHO, an unusual disturbance arrived. Solar wind speed in the 750 to near 1000 km/sec range was recorded until about 11h UTC. The source of this disturbance is at this time not obvious. The geomagnetic disturbance intensified strongly early on May 10 and reached major storm level.
Solar flux measured at 20h UTC on 2.8 GHz was 97.1. The planetary A
index was 29 (STAR Ap - based on the mean of three hour interval ap indices: 29.9).
Three hour interval K indices: 44555333 (planetary), 34555333 (Boulder).
The background x-ray flux is at the class B2 level.
At midnight there were 2 spotted regions on the visible disk. Solar flare activity was low. Only 1 C class event was recorded during the day. Region 10349 behind the southwest limb was the likely source of a C3.8 flare at 00:48 UTC.
Region 10351 decayed slowly and quietly.
New region 10356 rotated into view at the northeast limb on May 8 and was numbered the next day.
May 7-9: No obviously geoeffective CMEs observed.
Coronal hole history (since late October 2002)
Compare today's report with the situation one solar rotation ago: 28
days ago 27 days ago 26
days ago
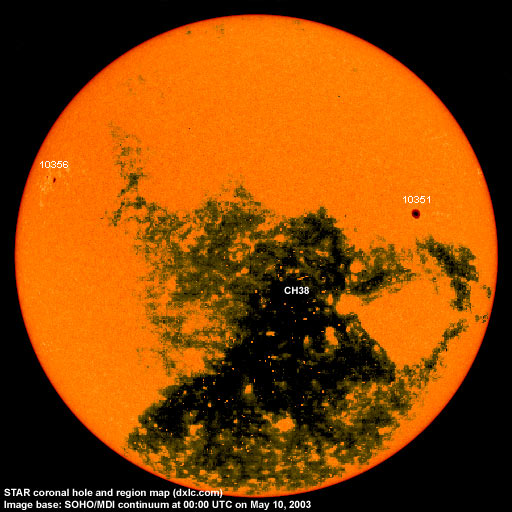
A huge recurrent coronal hole (CH38) in the southern hemisphere was in a geoeffective position on May 2-9.
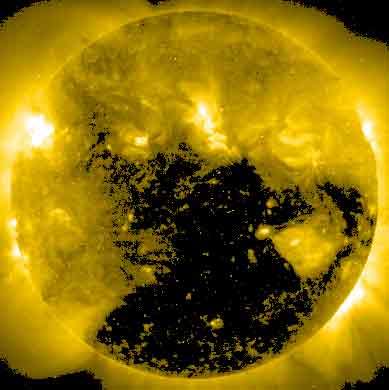
Processed SOHO EIT 284 image at 01:06 UTC on May 10. Any black areas on the solar disk are likely coronal holes.
The geomagnetic field is expected to be unsettled to major storm on May 10 and unsettled to minor storm May 11-12. Long distance medium wave (AM) band propagation along east-west paths over high and upper middle latitudes is useless to very poor and will likely be very poor until at least May 13. Propagation along north-south paths is good to very good and is likely to be at least fair until May 13. [Trans Atlantic propagation conditions are currently monitored every night on 1470 kHz. Dominant station tonight: Radio Cristal del Uruguay with a strong signal.]
| Coronal holes (1) | Coronal mass ejections (2) | M and X class flares (3) |
1) Effects from a coronal hole could reach Earth within the next 5 days.
2) Material from a CME is likely to impact Earth within 96 hours.
3) There is a possibility of either M or X class flares within the next 48 hours.
Green: 0-20% probability, Yellow: 20-60% probability, Red: 60-100% probability.
Compare to the previous day's image.
Data for all numbered solar regions according to the Solar Region Summary provided by SEC/NOAA. Comments are my own, as is the STAR spot count (spots observed at or inside a few hours before midnight) and data for regions not numbered by SEC or where SEC has observed no spots.
| Solar region | Date numbered | SEC spot count |
STAR spot count |
Location at midnight | Area | Classification | Comment |
|---|---|---|---|---|---|---|---|
| 10351 | 2003.04.30 | 1 | 1 | N10W41 | 0210 | HSX |
area was 0140 at midnight |
| 10352 | 2003.05.01 | S24W61 | plage | ||||
| 10353 | 2003.05.04 | S16W35 | plage | ||||
| 10354 | 2003.05.04 | N19W06 | plage | ||||
| 10355 | 2003.05.05 | N13W09 | plage | ||||
| 10356 | 2003.05.09 | 2 | 3 | N15E63 | 0110 | DSO |
formerly region S157 classification was DAO at midnight, area 0060 |
| S156 | emerged on 2003.05.07 |
S13W32 | plage | ||||
| Total spot count: | 3 | 4 | |||||
| SSN: | 23 | 24 | |||||
| Month | Average solar flux at Earth |
International sunspot number | Smoothed sunspot number |
|---|---|---|---|
| 2000.04 | 184.2 | 125.5 | 120.8 cycle 23 sunspot max. |
| 2000.07 | 202.3 | 170.1 | 119.8 |
| 2001.12 | 235.1 | 132.2 | 114.6 (-0.9) |
| 2002.04 | 189.8 | 120.7 | 110.5 (-2.9) |
| 2002.05 | 178.4 | 120.8 | 108.8 (-1.7) |
| 2002.06 | 148.7 | 88.3 | 106.2 (-2.6) |
| 2002.07 | 173.5 | 99.6 | 102.7 (-3.5) |
| 2002.08 | 183.6 | 116.4 | 98.7 (-4.0) |
| 2002.09 | 175.8 | 109.6 | 94.6 (-4.1) |
| 2002.10 | 167.0 | 97.5 | 90.5 (-4.1) |
| 2002.11 | 168.7 | 95.5 | (84.9 predicted, -5.6) |
| 2002.12 | 157.2 | 80.8 | (80.5 predicted, -4.4) |
| 2003.01 | 144.0 | 79.5 | (77.5 predicted, -3.0) |
| 2003.02 | 124.5 | 46.2 | (72.4 predicted, -5.1) |
| 2003.03 | 131.4 | 61.5 | (66.8 predicted, -5.6) |
| 2003.04 | 126.4 | 60.0 | (61.9 predicted, -4.9) |
| 2003.05 | 126.7 (1) | 35.1 (2) | (57.9 predicted, -4.0) |
1) Running average based on the daily 20:00 UTC observed solar flux value at 2800 MHz.
2) Unofficial, accumulated value based on the Boulder (SEC/NOAA) sunspot number. The official international sunspot number is typically 25-45% less.
This report has been prepared by Jan Alvestad. It is based partly on my own observations and interpretations, and partly on data from sources noted in solar links. All time references are to the UTC day. Comments and suggestions are always welcome.
| [DX-Listeners' Club] |