
Last update issued on May 14, 2003 at 02:10 UTC.
[Solar and geomagnetic data - last 4 weeks (updated daily)]
[Solar wind and electron fluence charts (updated daily)]
[Solar cycles 21-23 (last update May 1, 2003)]
[Solar cycles 1-20]
[Graphical comparison of cycles 21, 22 and 23 (last update May 1, 2003)]
[Graphical comparison of cycles 10, 13, 17, 20 and 23 (last update May 1, 2003)]
[Historical solar and geomagnetic data charts 1954-2003 (last update April 13, 2003)]
[Archived reports (last update May 12, 2003)]
The geomagnetic field was mostly active on May 13 with a single unsettled interval 03-06h UTC and a minor storm interval 09-12h UTC. Solar wind speed ranged between 607 and 787 km/sec under the influence of a high speed stream from coronal hole CH38.
Solar flux measured at 20h UTC on 2.8 GHz was 96.1. The planetary A
index was 27 (STAR Ap - based on the mean of three hour interval ap indices: 27.6).
Three hour interval K indices: 43454444 (planetary), 44453444 (Boulder).
The background x-ray flux is at the class A9 level.
At midnight there were 3 spotted regions on the visible disk. Solar flare activity was very low.
Region 10356 developed slowly and was quiet.
Region 10357 decayed slightly with the leading penumbra losing some area.
Region 10358 developed moderately quickly with several new spots emerging and penumbra forming on both polarities.
May 11-13: No obviously geoeffective CMEs observed. Over the last several days quite a few large backsided CMEs have been observed, all apparently from one or two sources in the northern hemisphere. It will still be several days until the region(s) generating this activity rotate into view.
Coronal hole history (since late October 2002)
Compare today's report with the situation one solar rotation ago: 28
days ago 27 days ago 26
days ago
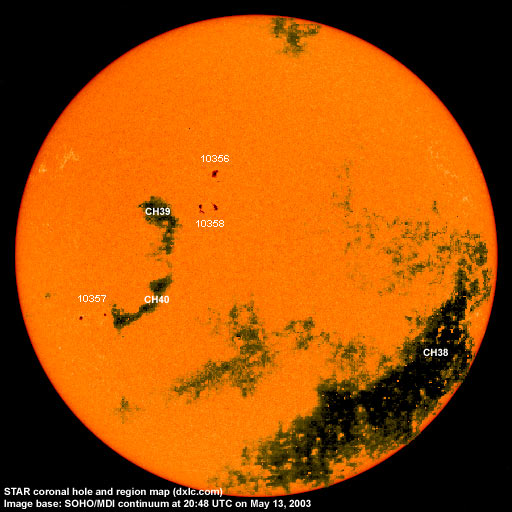
A huge recurrent coronal hole (CH38) in the southern hemisphere was in a geoeffective position on May 2-10. A small recurrent coronal hole (CH39) in the northern hemisphere will rotate into a geoeffective position on May 15, CH39 has decreased in size over the last rotation. A small recurrent coronal hole (CH40) in the southern hemisphere will rotate into a geoeffective position on May 15.
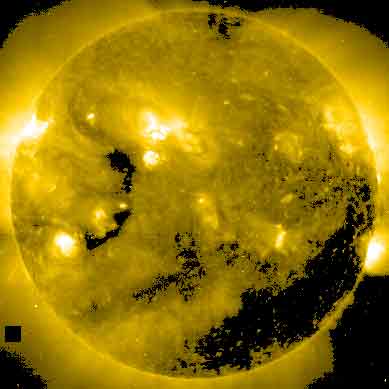
Processed SOHO EIT 284 image at 19:06 UTC on May 13. Any black areas on the solar disk are likely coronal holes.
The geomagnetic field is expected to be unsettled to minor storm on May 14 and quiet to active May 15-16. High speed streams from coronal holes CH39 and CH40 could reach Earth on May 18 and cause unsettled to active geomagnetic conditions that day and on May 19. Long distance medium wave (AM) band propagation along east-west paths over high and upper middle latitudes is very poor and will likely be very poor until at least May 17. Propagation along north-south paths is fair to good and is likely to be at least fair until May 16. [Trans Atlantic propagation conditions are currently monitored every night on 1470 kHz. Dominant station tonight: Radio Cristal del Uruguay. A couple of stations from Brazil were noted as well and in general reception conditions were best for stations from the northeastern part of Brazil.]
| Coronal holes (1) | Coronal mass ejections (2) | M and X class flares (3) |
1) Effects from a coronal hole could reach Earth within the next 5 days.
2) Material from a CME is likely to impact Earth within 96 hours.
3) There is a possibility of either M or X class flares within the next 48 hours.
Green: 0-20% probability, Yellow: 20-60% probability, Red: 60-100% probability.
Compare to the previous day's image.
Data for all numbered solar regions according to the Solar Region Summary provided by SEC/NOAA. Comments are my own, as is the STAR spot count (spots observed at or inside a few hours before midnight) and data for regions not numbered by SEC or where SEC has observed no spots.
| Solar region | Date numbered | SEC spot count |
STAR spot count |
Location at midnight | Area | Classification | Comment |
|---|---|---|---|---|---|---|---|
| 10353 | 2003.05.04 | S18W88 | rotated out of view | ||||
| 10354 | 2003.05.04 | N17W58 | plage | ||||
| 10355 | 2003.05.05 | N13W61 | plage | ||||
| 10356 | 2003.05.09 | 6 | 8 | N17E09 | 0060 | CAO |
area was 0080 at midnight |
| 10357 | 2003.05.11 | 4 | 4 | S16E43 | 0080 | DSO |
area was 0050 at midnight |
| 10358 | 2003.05.12 | 8 | 17 | N09E10 | 0040 | DSO |
classification was DAO at midnight, area 0080 |
| 10359 | 2003.05.12 | 1 | S16W32 | 0010 | AXX | now spotless | |
| S156 | emerged on 2003.05.07 |
S13W84 | plage | ||||
| Total spot count: | 19 | 29 | |||||
| SSN: | 59 | 59 | |||||
| Month | Average solar flux at Earth |
International sunspot number | Smoothed sunspot number |
|---|---|---|---|
| 2000.04 | 184.2 | 125.5 | 120.8 cycle 23 sunspot max. |
| 2000.07 | 202.3 | 170.1 | 119.8 |
| 2001.12 | 235.1 | 132.2 | 114.6 (-0.9) |
| 2002.04 | 189.8 | 120.7 | 110.5 (-2.9) |
| 2002.05 | 178.4 | 120.8 | 108.8 (-1.7) |
| 2002.06 | 148.7 | 88.3 | 106.2 (-2.6) |
| 2002.07 | 173.5 | 99.6 | 102.7 (-3.5) |
| 2002.08 | 183.6 | 116.4 | 98.7 (-4.0) |
| 2002.09 | 175.8 | 109.6 | 94.6 (-4.1) |
| 2002.10 | 167.0 | 97.5 | 90.5 (-4.1) |
| 2002.11 | 168.7 | 95.5 | (84.9 predicted, -5.6) |
| 2002.12 | 157.2 | 80.8 | (80.5 predicted, -4.4) |
| 2003.01 | 144.0 | 79.5 | (77.5 predicted, -3.0) |
| 2003.02 | 124.5 | 46.2 | (72.4 predicted, -5.1) |
| 2003.03 | 131.4 | 61.5 | (66.8 predicted, -5.6) |
| 2003.04 | 126.4 | 60.0 | (61.9 predicted, -4.9) |
| 2003.05 | 116.5 (1) | 41.4 (2) | (57.9 predicted, -4.0) |
1) Running average based on the daily 20:00 UTC observed solar flux value at 2800 MHz.
2) Unofficial, accumulated value based on the Boulder (SEC/NOAA) sunspot number. The official international sunspot number is typically 25-45% less.
This report has been prepared by Jan Alvestad. It is based partly on my own observations and interpretations, and partly on data from sources noted in solar links. All time references are to the UTC day. Comments and suggestions are always welcome.
| [DX-Listeners' Club] |