
Last major update issued on November 4, 2003 at 04:35 UTC. Minor update posted at 13:14 UTC.
[Solar and geomagnetic data - last month (updated daily)]
[Solar wind and electron fluence charts (updated daily)]
[Solar cycles 21-23 (last update November 4, 2003)]
[Solar cycles 1-20]
[Graphical comparison of cycles 21, 22 and 23 (last update November 4, 2003)]
[Graphical comparison of cycles 2, 10, 13, 17, 20 and 23 (last update November
4, 2003)]
[Historical solar and geomagnetic data charts 1954-2003 (last update October 15, 2003)]
[Archived reports (last update October 30, 2003)]
The geomagnetic field was quiet to unsettled on November 3. Solar wind speed ranged between 464 and 568 km/sec.
Solar flux measured at 20h UTC on 2.8 GHz was 166.9. The planetary A
index was 10 (STAR Ap - based on the mean of three hour interval ap indices: 11.5).
Three hour interval K indices: 33232323 (planetary), 33223323 (Boulder).
The background x-ray flux is at the class C2 level.
At midnight there were 6 spotted regions on the visible disk. Solar flare activity was high. A total of 3 C, 1 M and 2 X class events was recorded during the day. Optically uncorrelated flares: C4.4 at 19:54, C5.4 at 20:37 and C3.1 at 22:36 UTC.
Region 10486 decayed slowly as it began to rotate over the southwest limb. Flares: M3.9
at 15:32 UTC.
Region 10487 decayed slowly and quietly.
Region 10488 decayed in the trailing spot section and rotated partly out of view at the northwest limb. Further X class
flares are possible today and tomorrow while the region is at and just behind the limb. Flares: X2.7/2B at 01:30
and X3.9/2F at 09:55 UTC.
Region 10495 decayed slowly and quietly.
Spotted regions not numbered by NOAA/SEC:
[S297] A new region emerged in the northeast quadrant on November 3. Location at midnight: N12E07.
[S298] A new region emerged in the northeast quadrant on November 3 just west of region S297. Location at midnight: N13E01.
Comment added at 06:48 UTC on November 4: A fairly strong solar wind shock was observed at SOHO at 05:53 UTC when solar wind speed increased abruptly from 512 to 700 km/sec. The interplanetary magnetic field has initially been northwards.
Comment added at 09:16 UTC: The interplanetary magnetic field has swung strongly southwards and we can expect major to severe geomagnetic storming during the next 6-12 hours.
Comment added at 13:14 UTC: The planetary A index reached 119 for the 09-12h UTC interval. Since 10h UTC the interplanetary magnetic field has been solidly northwards, this has caused a significant decrease in the geomagnetic disturbance level.
Region 10486 at the southwest limb has been brightening the last hour and a slow increase in the background xray flux has been noted. Perhaps the region is preparing for another large flare?
November 3: No partially or fully Earth directed CMEs observed.
November 2: A fast and large full halo CME was observed after the X8 flare in region 10486. The CME could reach Earth early on November 4.
Coronal hole history (since late October 2002)
Compare today's report with the situation one solar rotation ago: 28
days ago 27 days ago 26 days ago
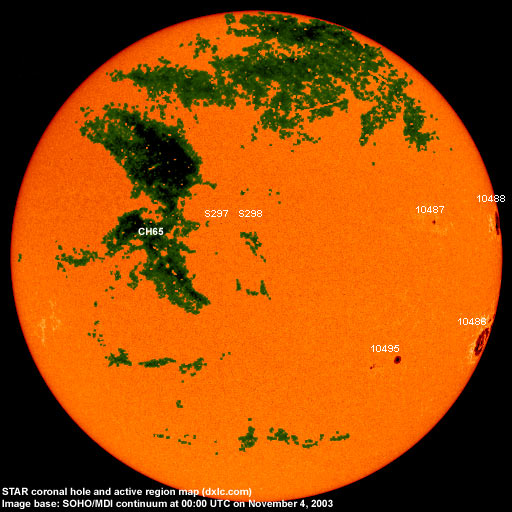
A small coronal hole (CH65) in the northern hemisphere could rotate into a geoeffective position on November 5-6.
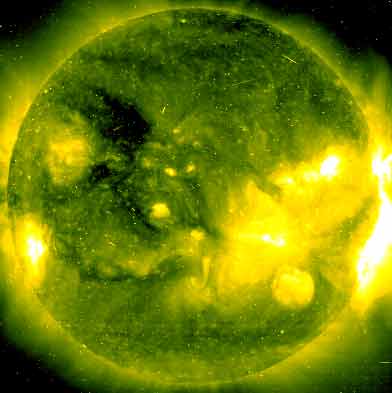
Processed SOHO/EIT 284 image at 01:06 UTC on November 4. Image quality is degraded because of a proton storm. The darkest areas on the solar disk are likely coronal holes.
The geomagnetic field is expected to be quiet to unsettled early on November 4. During the first half of the day a CME impact is expected and this could cause active to major geomagnetic storm conditions for the remainder of the day. Quiet to unsettled is likely on November 6-7 with a few unsettled to active intervals possible on November 7-8 due to a high speed stream from coronal hole CH65.
Long distance low frequency (below 2 MHz) propagation along east-west paths over high and upper middle latitudes is very poor. Propagation along long distance north-south paths is poor. [Trans Atlantic propagation conditions are currently monitored every night on 1470 kHz. Dominant station: Radio Cristal del Uruguay].
| Coronal holes (1) | Coronal mass ejections (2) | M and X class flares (3) |
1) Effects from a coronal hole could reach Earth within the next 5 days.
2) Material from a CME is likely to impact Earth within 96 hours.
3) There is a possibility of either M or X class flares within the next 48 hours.
Green: 0-20% probability, Yellow: 20-60% probability, Red: 60-100% probability.
Compare to the previous day's image.
Data for all numbered solar regions according to the Solar Region Summary provided by NOAA/SEC. Comments are my own, as is the STAR spot count (spots observed at or inside a few hours before midnight) and data for regions not numbered by SEC or where SEC has observed no spots.
| Solar region | Date numbered | SEC spot count |
STAR spot count |
Location at midnight | Area | Classification | Comment |
|---|---|---|---|---|---|---|---|
| 10486 | 2003.10.22 | 16 | 33 | S17W75 | 1430 | FKC | gamma-delta |
| 10487 | 2003.10.25 | 6 | 5 | N12W48 | 0040 | CSO |
classification was CAO at midnight |
| 10488 | 2003.10.27 | 9 | 10 | N08W82 | 1250 | FKC | beta-gamma-delta |
| 10489 | 2003.10.27 | S12W89 | plage | ||||
| 10490 | 2003.10.27 | S12W66 | plage | ||||
| 10491 | 2003.10.27 | S08W84 | plage | ||||
| 10494 | 2003.10.30 | S23W44 | plage | ||||
| 10495 | 2003.10.30 | 5 | 8 | S22W35 | 0110 | DSO | |
| 10496 | 2003.10.31 | S12W30 | plage | ||||
| S294 | emerged on 2003.10.29 |
S09W20 | plage | ||||
| S296 | emerged on 2003.11.01 |
S07E00 | plage | ||||
| S297 | emerged on 2003.11.03 |
1 | N12E07 | 0000 | AXX | ||
| S298 | emerged on 2003.11.03 |
2 | N13E01 | 0000 | BXO | ||
| Total spot count: | 36 | 59 | |||||
| SSN: | 76 | 119 | |||||
| Month | Average solar flux at Earth |
International sunspot number | Smoothed sunspot number |
|---|---|---|---|
| 2000.04 | 184.2 | 125.5 | 120.8 cycle 23 sunspot max. |
| 2000.07 | 202.3 | 170.1 | 119.8 |
| 2001.12 | 235.1 | 132.2 | 114.6 (-0.9) |
| 2002.09 | 175.8 | 109.6 | 94.6 (-4.1) |
| 2002.10 | 167.0 | 97.5 | 90.5 (-4.1) |
| 2002.11 | 168.7 | 95.5 | 85.2 (-5.3) |
| 2002.12 | 157.2 | 80.8 | 82.0 (-3.2) |
| 2003.01 | 144.0 | 79.7 | 80.9 (-1.1) |
| 2003.02 | 124.5 | 46.0 | 78.5 (-2.4) |
| 2003.03 | 131.4 | 61.1 | 74.1 (-4.4) |
| 2003.04 | 126.4 | 60.0 | 70.3 (-3.8) |
| 2003.05 | 115.7 | 55.2 | (66.8 predicted, -3.5) |
| 2003.06 | 129.3 | 77.4 | (63.0 predicted, -3.8) |
| 2003.07 | 127.7 | 85.0 | (59.3 predicted, -3.7) |
| 2003.08 | 122.1 | 72.7 | (56.3 predicted, -3.0) |
| 2003.09 | 112.2 | 48.8 | (54.3 predicted, -2.0) |
| 2003.10 | 151.7 | 65.6 | (51.6 predicted, -2.7) |
| 2003.11 | 189.2 (1) | 17.0 (2) | (48.9 predicted, -2.7) |
1) Running average based on the daily 20:00 UTC observed solar flux value at 2800 MHz.
2) Unofficial, accumulated value based on the Boulder (NOAA/SEC) sunspot number. The official international sunspot number is typically
30-50% less.
This report has been prepared by Jan Alvestad. It is based partly on my own observations and analysis, and partly on data from sources noted in solar links. All time references are to the UTC day. Comments and suggestions are always welcome.
| [DX-Listeners' Club] |